

Question: This dashboard has three visualizations that show the average amount of assets within a retirement plan per person in that plan, the balance of total
This dashboard has three visualizations that show the average amount of assets within a retirement plan per person in that plan, the balance of total assets of defined benefit and defined contribution plans, and the relative contributions to each plan by year.
How much money was invested into defined contribution plans in 2010 (assume the last year shown is 2019)?
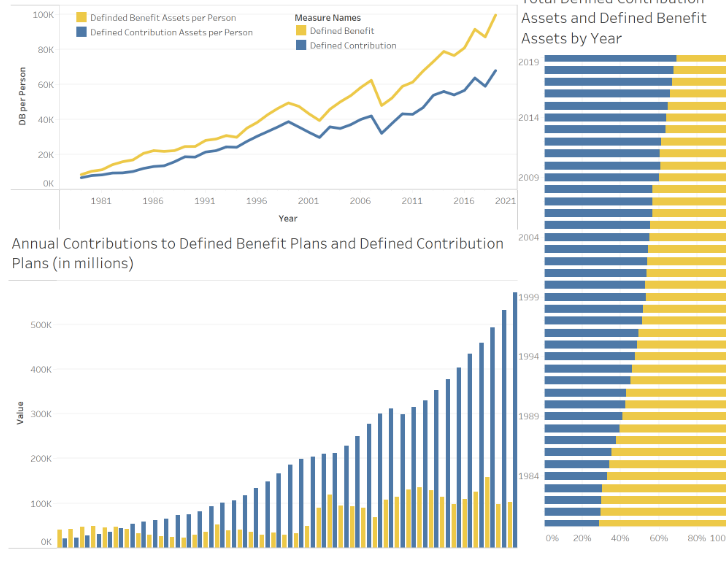
Ass As: 019 014 009 Annual Contributions to Defined Benefit Plans and Defined Contribution 2004 Plans (in millions)
Step by Step Solution
There are 3 Steps involved in it
1 Expert Approved Answer
Step: 1 Unlock

Question Has Been Solved by an Expert!
Get step-by-step solutions from verified subject matter experts
Step: 2 Unlock
Step: 3 Unlock