Question: This data is a population rather than a sample because it shows all of the different flights that are coming in and out oregon during
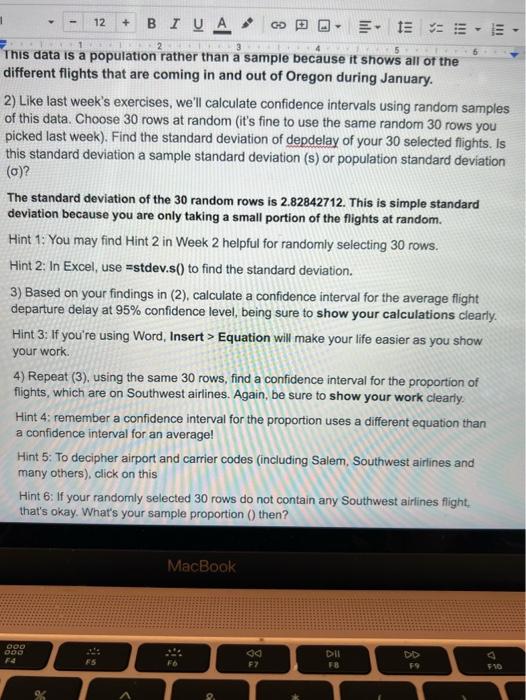
This data is a population rather than a sample because it shows all of the different flights that are coming in and out oregon during January. 2) Like last week's exercises, we'll calculate confidence intervals using random samples of this data. Choose 30 rows at random (it's fine to use the same random 30 rows you picked last week). Find the standard deviation of depdelay of your 30 selected flights. Is this standard deviation a sample standard deviation (s) or population standard deviation (c) ? The standard deviation of the 30 random rows is 2.82842712. This is simple standard deviation because you are only taking a small portion of the flights at random. Hint 1: You may find Hint 2 in Week 2 helpful for randomly selecting 30 rows. Hint 2: In Excel, use =stdev.s() to find the standard deviation. 3) Based on your findings in (2), calculate a confidence interval for the average flight departure delay at 95% confidence level, being sure to show your calculations clearly. Hint 3 : If you're using Word, Insert > Equation will make your life easier as you show your work. 4) Repeat (3), using the same 30 rows, find a confidence interval for the proportion of flights, which are on Southwest airlines. Again, be sure to show your work clearly. Hint 4: remember a confidence interval for the proportion uses a different equation than a confidence interval for an average! Hint 5: To decipher airport and carrier codes (including Salem, Southwest airlines and many others), click on this Hint 6: If your randomly selected 30 rows do not contain any Southwest airlines flight, that's okay. What's your sample proportion () then? This data is a population rather than a sample because it shows all of the different flights that are coming in and out oregon during January. 2) Like last week's exercises, we'll calculate confidence intervals using random samples of this data. Choose 30 rows at random (it's fine to use the same random 30 rows you picked last week). Find the standard deviation of depdelay of your 30 selected flights. Is this standard deviation a sample standard deviation (s) or population standard deviation (c) ? The standard deviation of the 30 random rows is 2.82842712. This is simple standard deviation because you are only taking a small portion of the flights at random. Hint 1: You may find Hint 2 in Week 2 helpful for randomly selecting 30 rows. Hint 2: In Excel, use =stdev.s() to find the standard deviation. 3) Based on your findings in (2), calculate a confidence interval for the average flight departure delay at 95% confidence level, being sure to show your calculations clearly. Hint 3 : If you're using Word, Insert > Equation will make your life easier as you show your work. 4) Repeat (3), using the same 30 rows, find a confidence interval for the proportion of flights, which are on Southwest airlines. Again, be sure to show your work clearly. Hint 4: remember a confidence interval for the proportion uses a different equation than a confidence interval for an average! Hint 5: To decipher airport and carrier codes (including Salem, Southwest airlines and many others), click on this Hint 6: If your randomly selected 30 rows do not contain any Southwest airlines flight, that's okay. What's your sample proportion () then