

Question: This exercise provides a total of 1 3 date visualizations that describe a real company's performance based on 1 7 quarters of financial dato. The

This exercise provides a total of date visualizations that describe a real company's performance based on quarters of financial dato. The visualizations ore grouped into five dashboards that were created in Tobleau: sales analysis, gross margin analysis, operating expense onalysis, profitobility analysis, and market performance analysis.
Requlred:
For each section, review the Tableau visualizations and answer the questions.
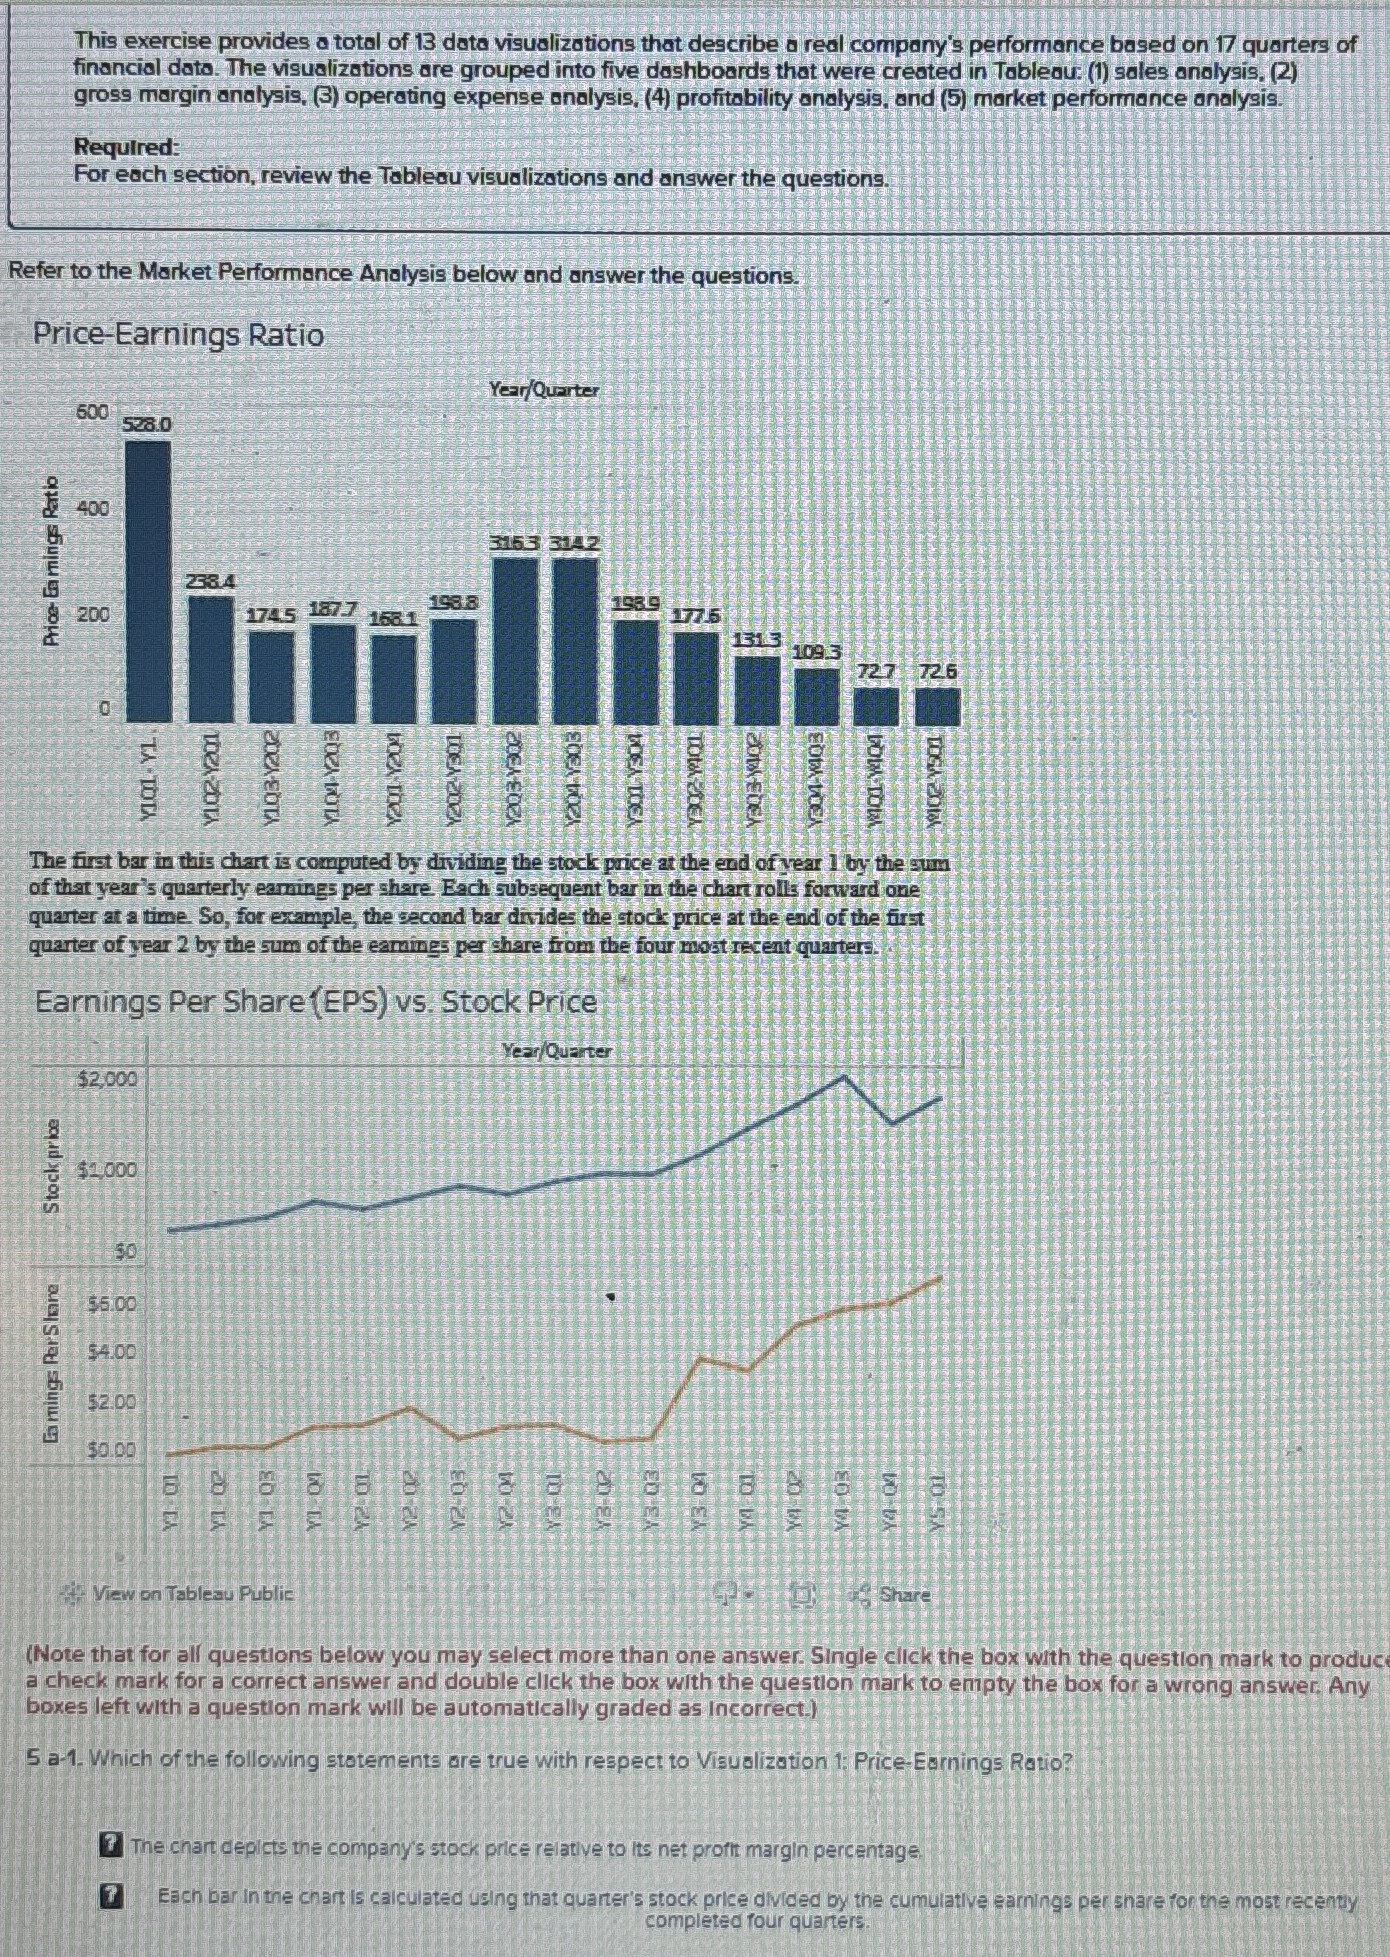
Refer to the Market Performance Analysis below and answer the questions.
PriceEarnings Ratio
The first bar in this chart is computed by dividing the stock price at the ead of year by the gum of that year's quarterly eamings per share. Each subsequent bar in the chart rolls forward one quarter at a time. So for example, the second bar divides the stock price at the end of the first quarter of year by the sum of the eamings per share from the four most IIcent quarters.
Earnings Per Share EPS vs Stock Price
View on Tableau Publis
Share
Note that for all questions below you may select more than one answer. Single click the box with the question mark to produc a check mark for a correct answer and double click the box with the question mark to empty the box for a wrong answer. Any boxes left with a question mark will be automatically graded as incorrect.
a Which of the following statements are true with respect to Visuolization : PriceEarnings Ratio?
The chart depicts the company's stock price relative to its net proft margin percentage.
Each bar in the chart is calculated using that quantr's stock price divided by the cumulative earnings per share for the most recenty completed four quarters.
Step by Step Solution
There are 3 Steps involved in it
1 Expert Approved Answer
Step: 1 Unlock

Question Has Been Solved by an Expert!
Get step-by-step solutions from verified subject matter experts
Step: 2 Unlock
Step: 3 Unlock