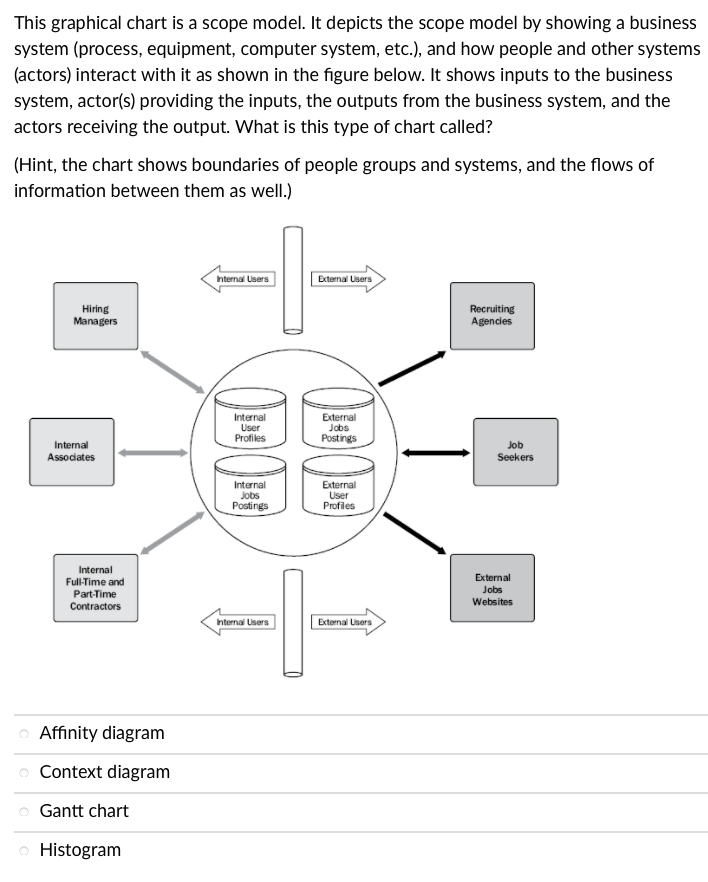
Question: This graphical chart is a scope model. It depicts the scope model by showing a business system (process, equipment, computer system, etc.), and how people

This graphical chart is a scope model. It depicts

This graphical chart is a scope model. It depicts the scope model by showing a business system (process, equipment, computer system, etc.), and how people and other systems (actors) interact with it as shown in the figure below. It shows inputs to the business system, actor(s) providing the inputs, the outputs from the business system, and the actors receiving the output. What is this type of chart called? (Hint, the chart shows boundaries of people groups and systems, and the flows of information between them as well.) Hiring Managers Internal Associates Internal Full-Time and Part-Time Contractors Affinity diagram o Context diagram Gantt chart o Histogram Internal Users Internal User Profiles Internal Jobs Postings Internal Users External Users External Jobs Postings External User Profiles External Users Recruiting Agencies Job Seekers External Jobs Websites

Step by Step Solution

There are 3 Steps involved in it

1 Expert Approved Answer
Step: 1 Unlock blur-text-image
Question Has Been Solved by an Expert!

Get step-by-step solutions from verified subject matter experts

Step: 2 Unlock
Step: 3 Unlock

Students Have Also Explored These Related General Management Questions!