

Question: THIS HAS TO BE DONE IN R & RSTUDIO PROGRAMMING LANGUAGE Paste the R commands for each question below, along with the output. # your
THIS HAS TO BE DONE IN R & RSTUDIO PROGRAMMING LANGUAGE
Paste the R commands for each question below, along with the output. # your name to it.
*Use script editor to build, run, edit and redo codes as necessary
Problem 1. Greg works for a national credit card company and he is performing a customer value analysis on a subset of credit card customers. In order to perform the RFM analysis on the customers call Greg has compiled a data set that contains the dates of the last transaction (LastTransactionDate), total number of transactions in the past two years (Frequency), and total spending during the past two years (Spending). Use the dataset Credit_Cards.xlsx to view the data.
a) Greg wants to calculate the number of days between January 1 2019 and the last transaction date. Create a new variable called DaysSinceLast That contains the number of days since the last transaction. (Hint: use the as.Date, difftime functions in the process) What is the average number of days since the last purchase for all the customers?
b) Create RFM scores for each customer using the 80/20 principle. (Hint: Create a new variable Freq to prevent overwriting existing data columns) How many customers have an RFM score of 555? What is the average spending of these high scoring customers?
c) Create a new variable called LogSpending That contains the natural logarithms for the total spending during the past two years. Bin the logarithm values into 5 equal interval-groups. (Hint: use breaks = 5 option in the process) Label the groups using the numbers 1 (lowest values) to 5 (highest values). How many observations are in group 2?
d) Create a new variable called AverageOrderSize that contains the average spending per order. This is calculated by dividing the total spending (Spending) by total number of transaction (Frequency) in the past two years. Bin the values of AverageOrderSize into five equal-interval groups. (Hint: use breaks = 5 option in the process). Label the five groups using the numbers 1 (lowest values) and 5 (highest values). How many observations are in group 2?
e) Compare the groups in question parts c) and d). Are the groupings for spending the same or different?
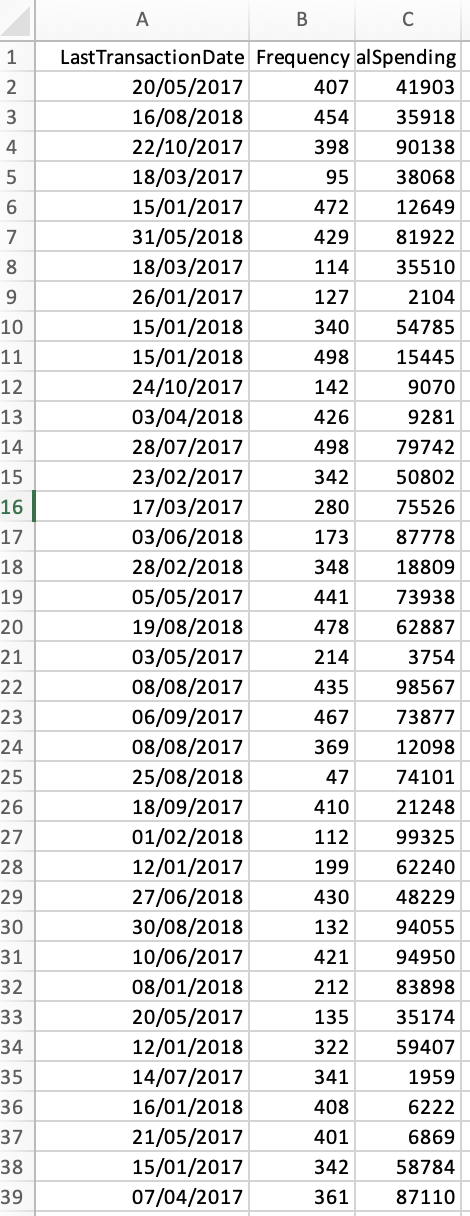
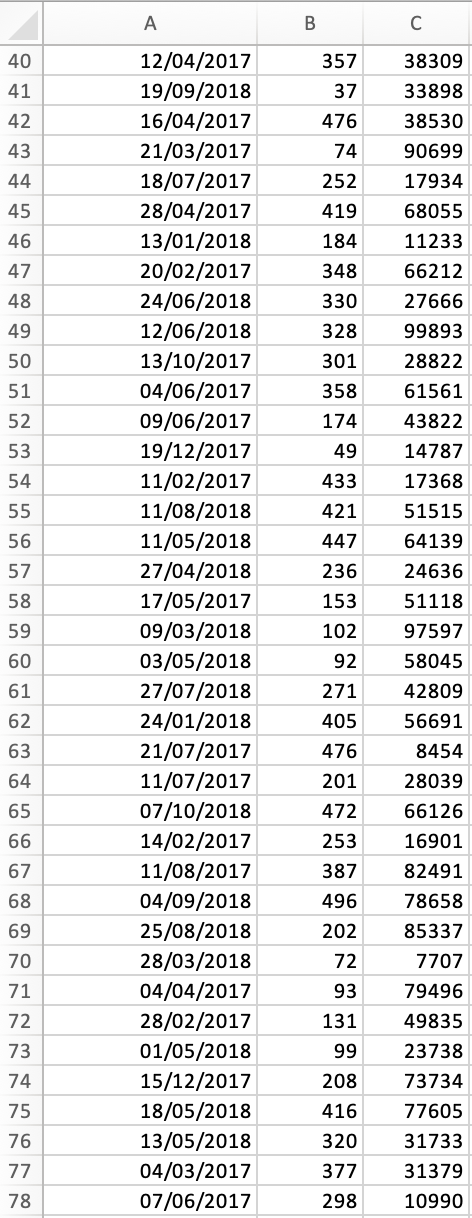
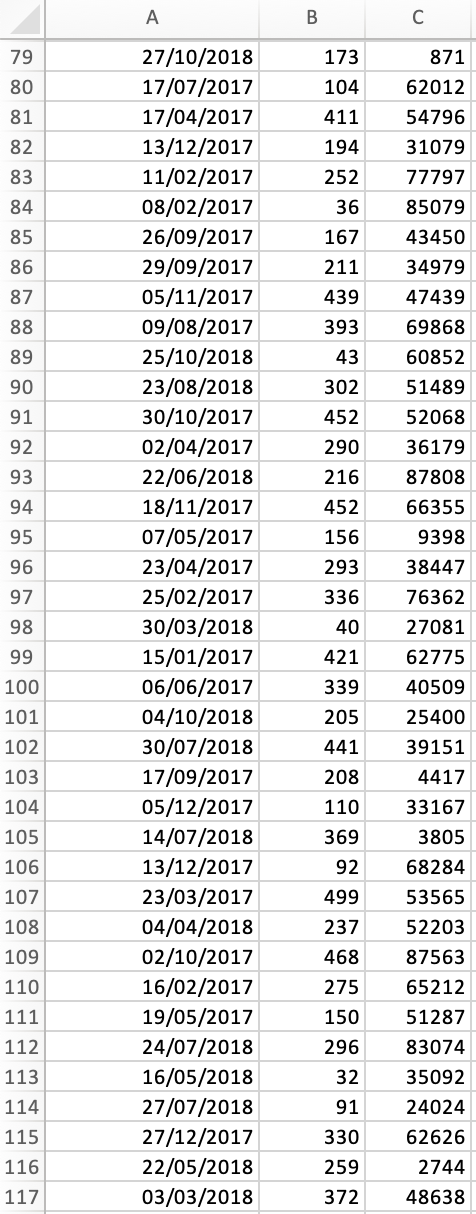
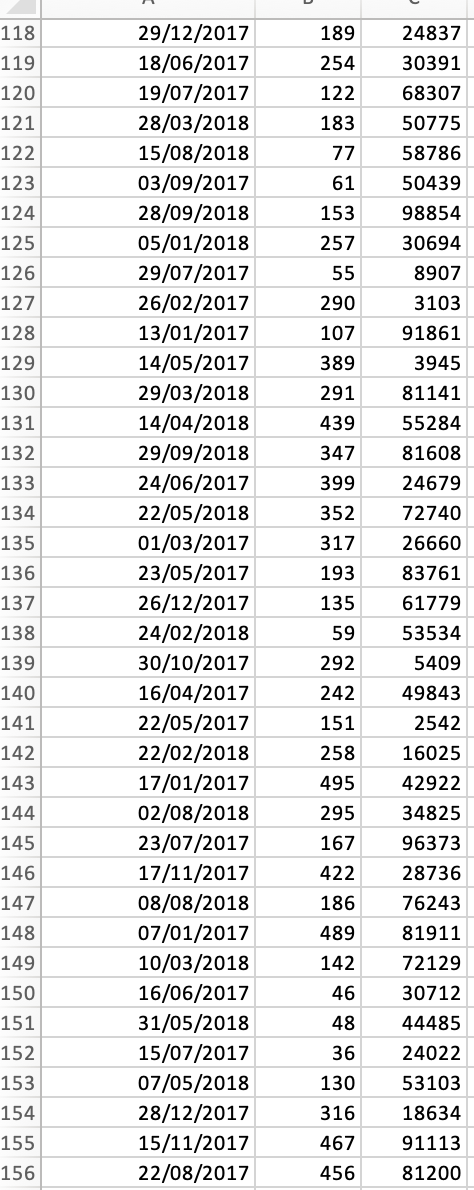
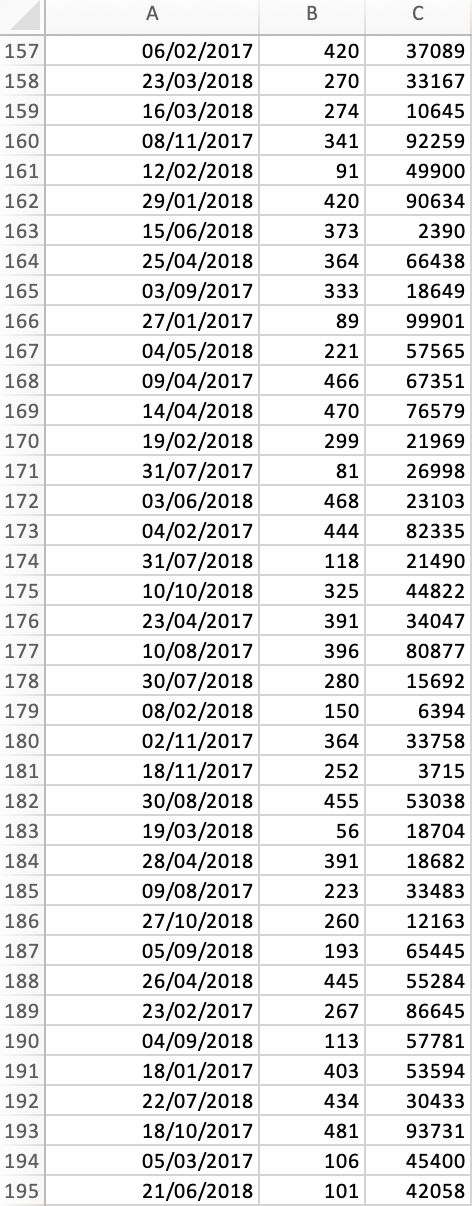
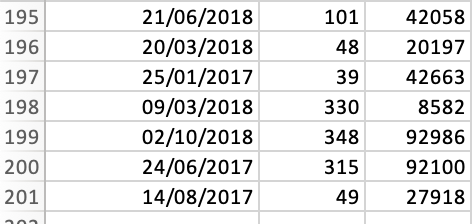
A B C \begin{tabular}{|r|r|r|r|} \hline 1 & Last TransactionDate & Frequency alSpending \\ \hline 2 & 20/05/2017 & 407 & 41903 \\ \hline 3 & 16/08/2018 & 454 & 35918 \\ \hline 4 & 22/10/2017 & 398 & 90138 \\ \hline 5 & 18/03/2017 & 95 & 38068 \\ \hline 6 & 15/01/2017 & 472 & 12649 \\ \hline 7 & 31/05/2018 & 429 & 81922 \\ \hline 8 & 18/03/2017 & 114 & 35510 \\ \hline 9 & 26/01/2017 & 127 & 2104 \\ \hline 10 & 15/01/2018 & 340 & 54785 \\ \hline 11 & 15/01/2018 & 498 & 15445 \\ \hline 12 & 24/10/2017 & 142 & 9070 \\ \hline 13 & 03/04/2018 & 426 & 9281 \\ \hline 14 & 28/07/2017 & 498 & 79742 \\ \hline 15 & 23/02/2017 & 342 & 50802 \\ \hline 16 & 17/03/2017 & 280 & 75526 \\ \hline 36 & 03/06/2018 & 173 & 87778 \\ \hline 37 & 28/02/2018 & 348 & 18809 \\ \hline 39 & 05/05/2017 & 441 & 73938 \\ \hline 18 & 15 & 15/01/2017 & \end{tabular} \begin{tabular}{|r|r|r|r|} \hline & A & B & C \\ \hline 79 & 27/10/2018 & 173 & 871 \\ \hline 80 & 17/07/2017 & 104 & 62012 \\ \hline 81 & 17/04/2017 & 411 & 54796 \\ \hline 82 & 13/12/2017 & 194 & 31079 \\ \hline 83 & 11/02/2017 & 252 & 77797 \\ \hline 84 & 08/02/2017 & 36 & 85079 \\ \hline 85 & 26/09/2017 & 167 & 43450 \\ \hline 86 & 29/09/2017 & 211 & 34979 \\ \hline 87 & 05/11/2017 & 439 & 47439 \\ \hline 88 & 09/08/2017 & 393 & 69868 \\ \hline 89 & 25/10/2018 & 43 & 60852 \\ \hline 90 & 23/08/2018 & 302 & 51489 \\ \hline 91 & 30/10/2017 & 452 & 52068 \\ \hline 92 & 02/04/2017 & 290 & 36179 \\ \hline 93 & 22/06/2018 & 216 & 87808 \\ \hline 94 & 18/11/2017 & 452 & 66355 \\ \hline 95 & 07/05/2017 & 156 & 9398 \\ \hline 96 & 23/04/2017 & 293 & 38447 \\ \hline 91 & 22/05/2018 & 259 & 2744 \\ \hline 117 & 25/03/2018 & 372 & 48638 \\ \hline \end{tabular} \begin{tabular}{|r|r|r|r|} \hline 195 & 21/06/2018 & 101 & 42058 \\ \hline 196 & 20/03/2018 & 48 & 20197 \\ \hline 197 & 25/01/2017 & 39 & 42663 \\ \hline 198 & 09/03/2018 & 330 & 8582 \\ \hline 199 & 02/10/2018 & 348 & 92986 \\ \hline 200 & 24/06/2017 & 315 & 92100 \\ \hline 201 & 14/08/2017 & 49 & 27918 \\ \hline \end{tabular}
Step by Step Solution
There are 3 Steps involved in it

Get step-by-step solutions from verified subject matter experts