

Question: This is a 3 question example used on rStudio: ## Exercise 3 For this example we'll use the `Default` dataset from the `ISLR` package. Student
This is a 3 question example used on rStudio:
## Exercise 3
For this example we'll use the `Default` dataset from the `ISLR` package. Student status, bank balance, and annual income were used to predict the probability that a given individual defaults on their loan. Run the following code chunk to create a table comparing the model's predictions (defined on rows) to actual default status (defined on columnns).
```{r} tab
colnames(tab)
Create a confusion matrix of the `default_table` object created above in order to answer the questions below.
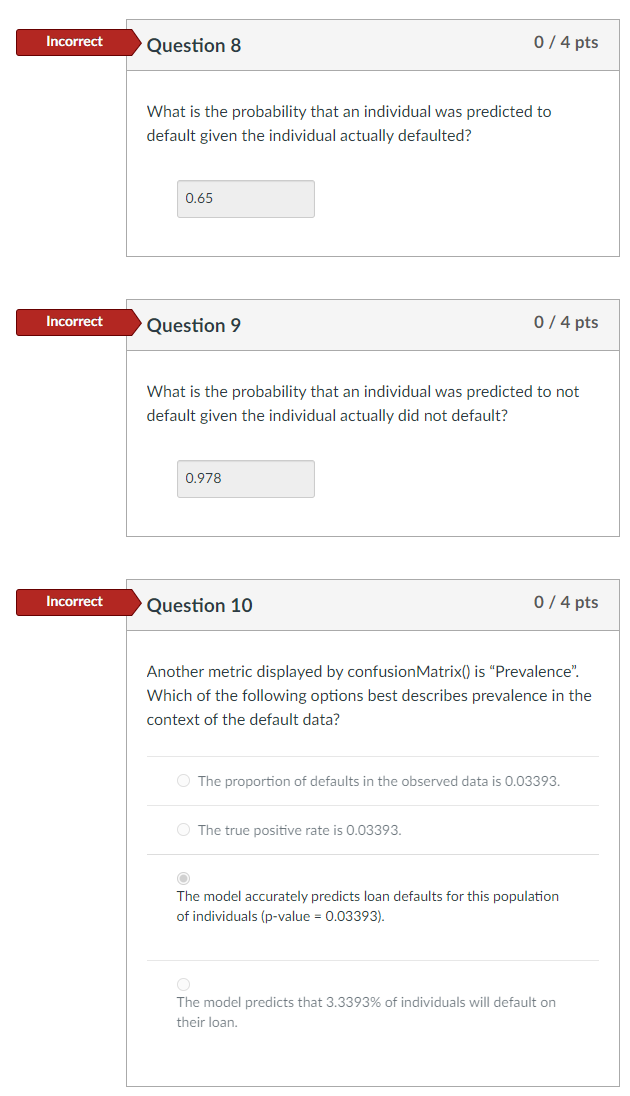
Incorrect Question 8 0 / 4 pts What is the probability that an individual was predicted to default given the individual actually defaulted? 0.65 Incorrect Question 9 0 / 4 pts What is the probability that an individual was predicted to not default given the individual actually did not default? 0.978 Incorrect Question 10 0 / 4 pts Another metric displayed by confusionMatrix() is "Prevalence". Which of the following options best describes prevalence in the context of the default data? O The proportion of defaults in the observed data is 0.03393. O The true positive rate is 0.03393. O The model accurately predicts loan defaults for this population of individuals (p-value = 0.03393). O The model predicts that 3.3393% of individuals will default on their loan
Step by Step Solution
There are 3 Steps involved in it

Get step-by-step solutions from verified subject matter experts