

Question: This is a business analytics course. I need the codes that generate the following answers for question 32. I am using R software on Postit
This is a business analytics course. I need the codes that generate the following answers for question 32. I am using R software on Postit Cloud. I also attached the file below. This question is based off of this book. Product: Business Analytics
Edition: 2nd
Author:Sanjiv Jaggia,Alison Kelly,Kevin Lertwachara,Leida Chen
ISBN10:1265686726
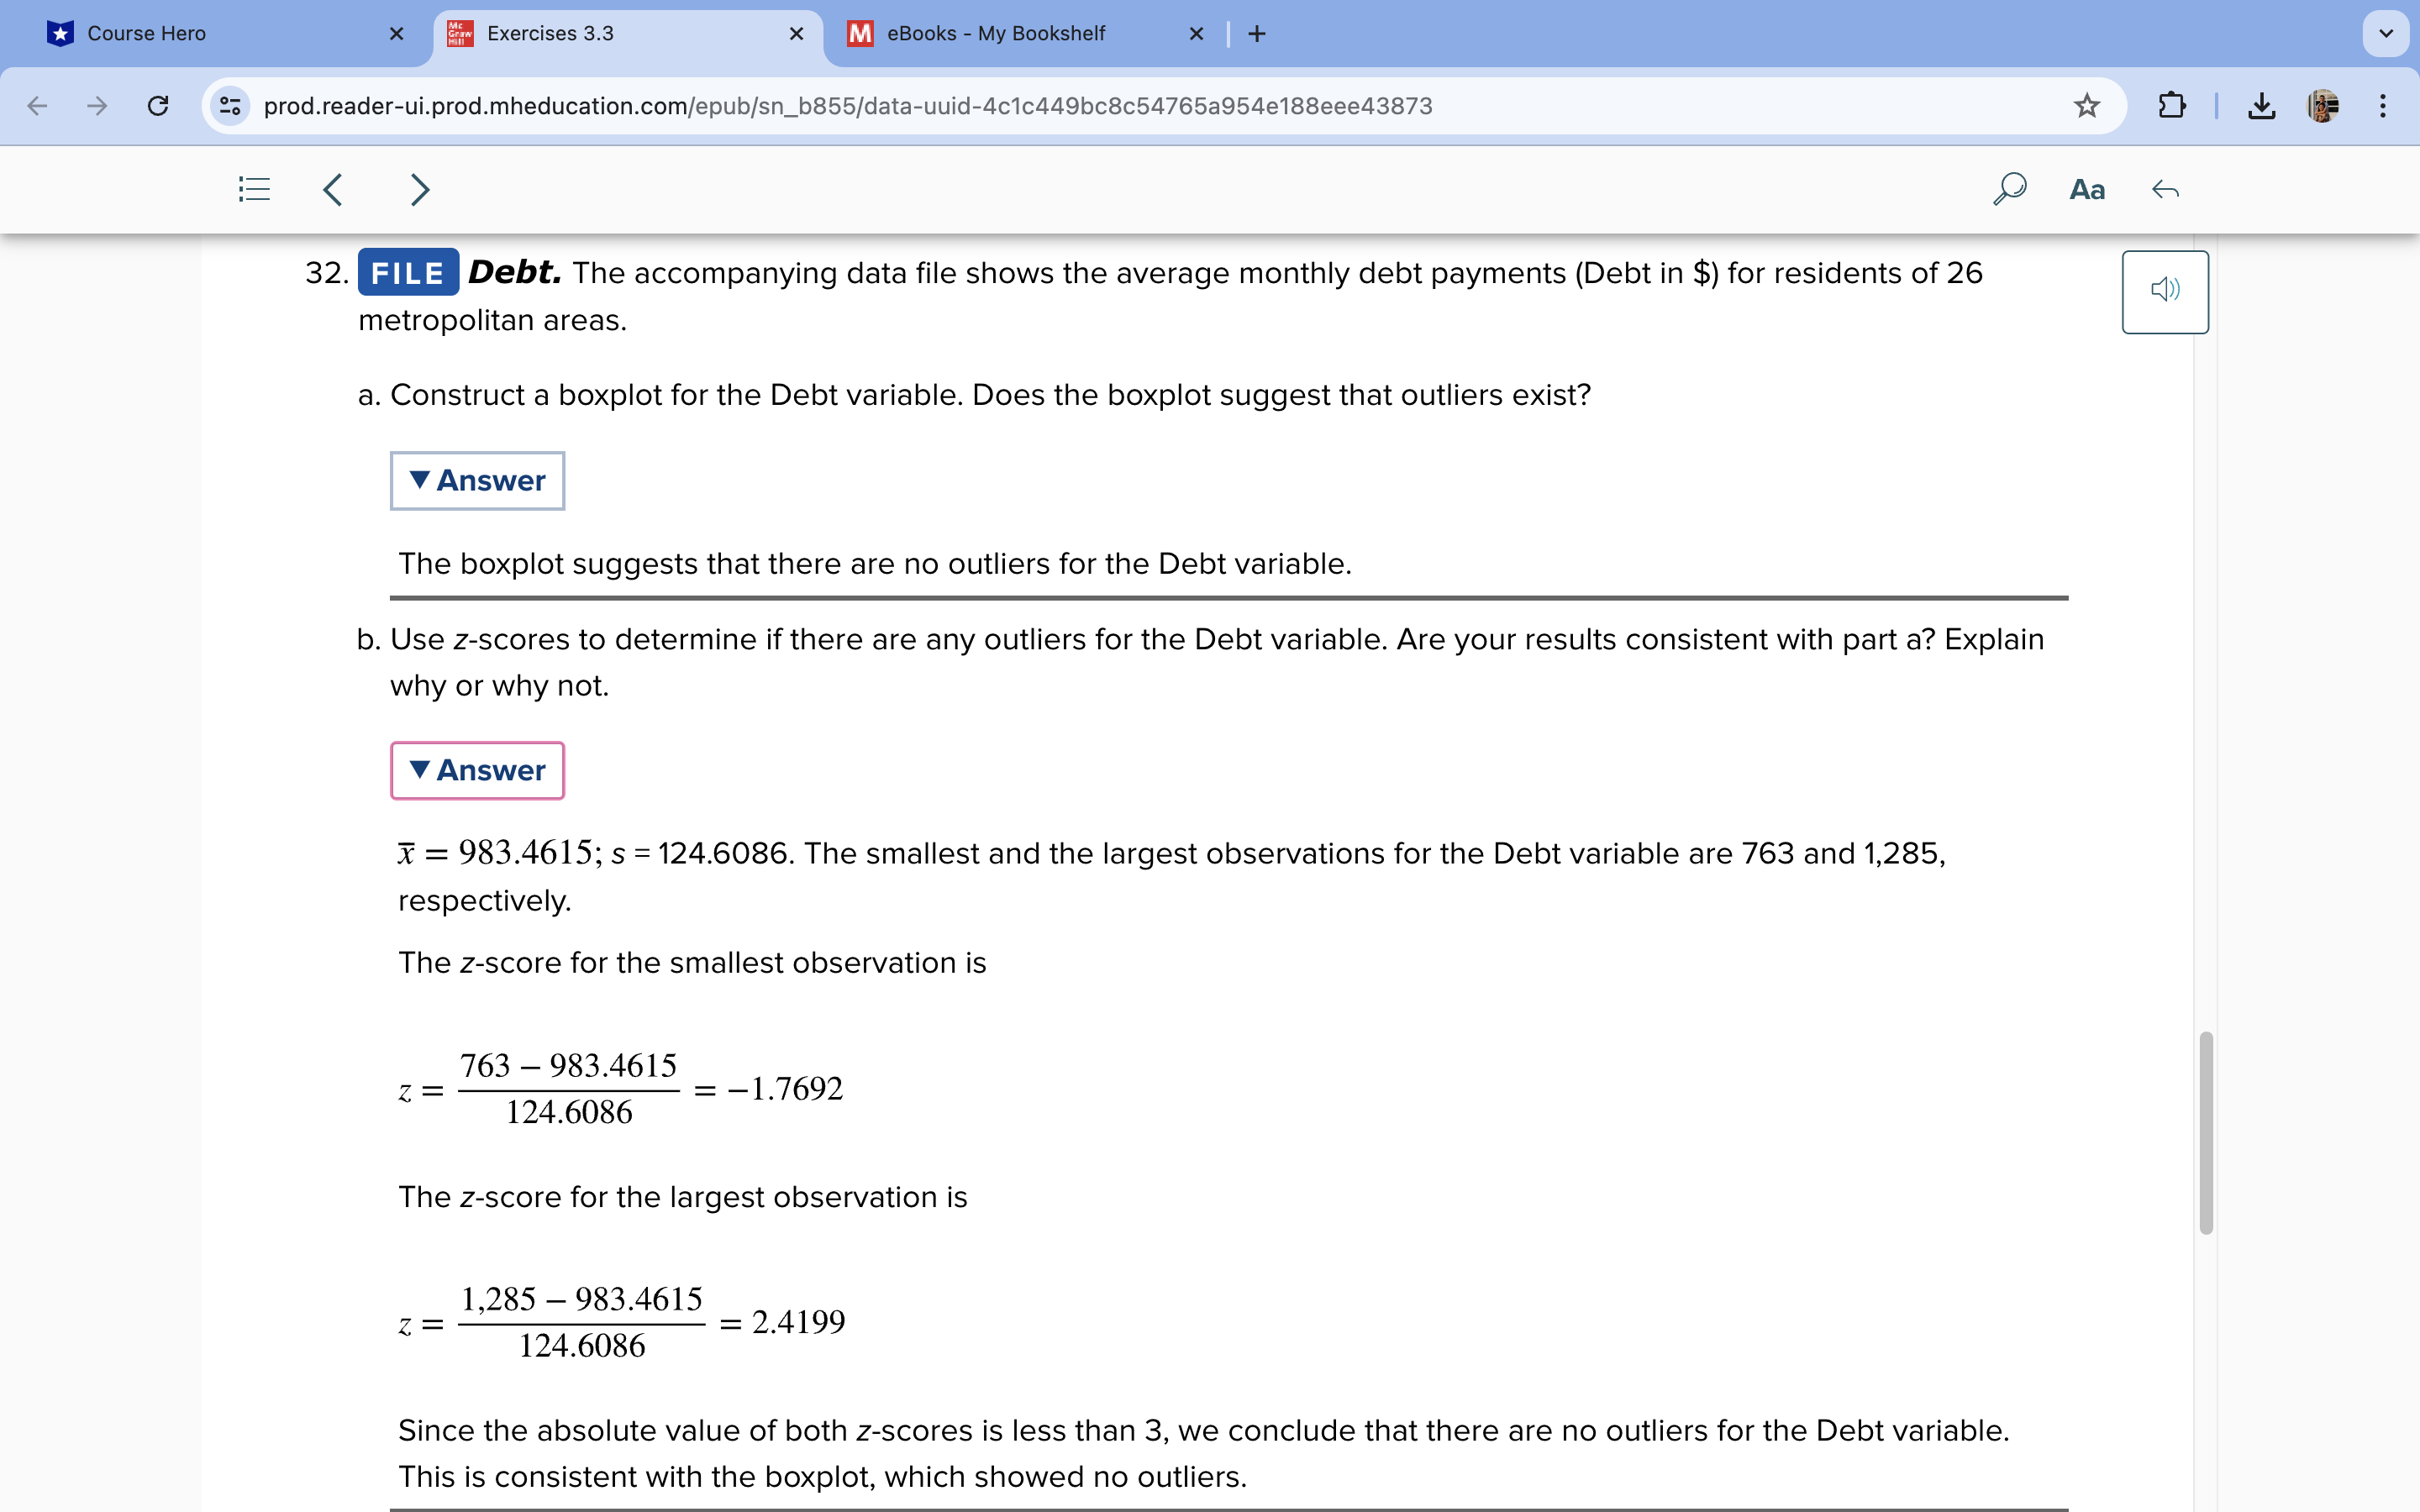
Course Hero X Exercises 3.3 X M eBooks - My Bookshelf * + v C go prod.reader-ui.prod.mheducation.com/epub/sn_6855/data-uuid-4c1c449bc8c54765a954e188eee43873 : Aa 32. FILE Debt. The accompanying data file shows the average monthly debt payments (Debt in $) for residents of 26 metropolitan areas. a. Construct a boxplot for the Debt variable. Does the boxplot suggest that outliers exist? Answer The boxplot suggests that there are no outliers for the Debt variable. b. Use z-scores to determine if there are any outliers for the Debt variable. Are your results consistent with part a? Explain why or why not. Answer x = 983.4615; s = 124.6086. The smallest and the largest observations for the Debt variable are 763 and 1,285, respectively. The z-score for the smallest observation is 763 - 983.4615 Z = = -1.7692 124.6086 The z-score for the largest observation is 1,285 - 983.4615 Z = = 2.4199 124.6086 Since the absolute value of both z-scores is less than 3, we conclude that there are no outliers for the Debt variable. This is consistent with the boxplot, which showed no outliers
Step by Step Solution
There are 3 Steps involved in it

Get step-by-step solutions from verified subject matter experts