

Question: this is a conceptual question, no calculation is needed 12. The iShares Edge MSCI USA Momentum Factor ETF (MTUM) is designed to gain exposure to
this is a conceptual question, no calculation is needed
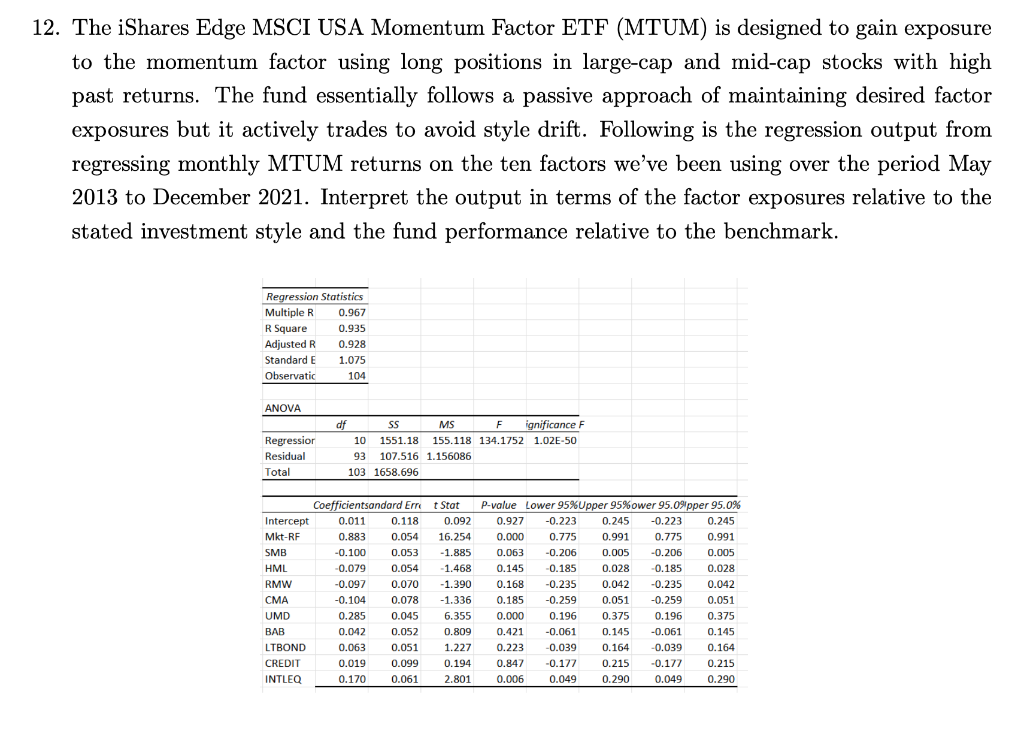
12. The iShares Edge MSCI USA Momentum Factor ETF (MTUM) is designed to gain exposure to the momentum factor using long positions in large-cap and mid-cap stocks with high past returns. The fund essentially follows a passive approach of maintaining desired factor exposures but it actively trades to avoid style drift. Following is the regression output from regressing monthly MTUM returns on the ten factors we've been using over the period May 2013 to December 2021. Interpret the output in terms of the factor exposures relative to the stated investment style and the fund performance relative to the benchmark. Regression Statistics Multiple R 0.967 R Square 0.935 Adjusted R 0.928 Standard E 1.075 Observatic 104 ANOVA Regressior Residual Total df SS MS F ignificance F 10 1551.18 155.118 134.1752 1.02E-50 93 107.516 1.156086 103 1658.696 Coefficientsandard Erre Intercept 0.011 0.118 Mkt-RF 0.883 0.054 SMB -0.100 0.053 HML -0,079 0.054 RMW -0.097 0.070 CMA -0.104 0.078 UMD 0.285 0.045 BAB 0.042 0.052 LTBOND 0.063 0.051 CREDIT 0.019 0.099 INTLEQ 0.170 0.061 t Stat 0.092 16.254 -1.885 -1.468 -1.390 -1.336 6.355 0.809 . 1.227 0.194 2.801 P-value Lower 95%Upper 95%ower 95.0%pper 95.0% 0.927 -0.223 0.245 -0.223 0.245 0.000 0.775 0.991 0.775 0.991 0.063 -0.206 0.005 -0.206 0.005 0.145 0.185 0.028 -0.185 0.028 0.168 -0.235 0.042 -0.235 0.042 0.185 -0.259 0.051 -0.259 0.051 wce 0.000 0.196 0.375 0.196 0.375 wan 0.421 -0.061 0.145 -0.061 0.145 0.223 -0.039 0.164 -0.039 0.164 0.847 -0.177 0.215 -0.177 0.215 0.006 0.049 0.290 0.049 0.290 12. The iShares Edge MSCI USA Momentum Factor ETF (MTUM) is designed to gain exposure to the momentum factor using long positions in large-cap and mid-cap stocks with high past returns. The fund essentially follows a passive approach of maintaining desired factor exposures but it actively trades to avoid style drift. Following is the regression output from regressing monthly MTUM returns on the ten factors we've been using over the period May 2013 to December 2021. Interpret the output in terms of the factor exposures relative to the stated investment style and the fund performance relative to the benchmark. Regression Statistics Multiple R 0.967 R Square 0.935 Adjusted R 0.928 Standard E 1.075 Observatic 104 ANOVA Regressior Residual Total df SS MS F ignificance F 10 1551.18 155.118 134.1752 1.02E-50 93 107.516 1.156086 103 1658.696 Coefficientsandard Erre Intercept 0.011 0.118 Mkt-RF 0.883 0.054 SMB -0.100 0.053 HML -0,079 0.054 RMW -0.097 0.070 CMA -0.104 0.078 UMD 0.285 0.045 BAB 0.042 0.052 LTBOND 0.063 0.051 CREDIT 0.019 0.099 INTLEQ 0.170 0.061 t Stat 0.092 16.254 -1.885 -1.468 -1.390 -1.336 6.355 0.809 . 1.227 0.194 2.801 P-value Lower 95%Upper 95%ower 95.0%pper 95.0% 0.927 -0.223 0.245 -0.223 0.245 0.000 0.775 0.991 0.775 0.991 0.063 -0.206 0.005 -0.206 0.005 0.145 0.185 0.028 -0.185 0.028 0.168 -0.235 0.042 -0.235 0.042 0.185 -0.259 0.051 -0.259 0.051 wce 0.000 0.196 0.375 0.196 0.375 wan 0.421 -0.061 0.145 -0.061 0.145 0.223 -0.039 0.164 -0.039 0.164 0.847 -0.177 0.215 -0.177 0.215 0.006 0.049 0.290 0.049 0.290
Step by Step Solution
There are 3 Steps involved in it

Get step-by-step solutions from verified subject matter experts