

Question: this is a conceptual question, no calculation is needed 13. The Fidelity OTC Portfolio mutual fund is an actively managed fund. Following is the output
this is a conceptual question, no calculation is needed
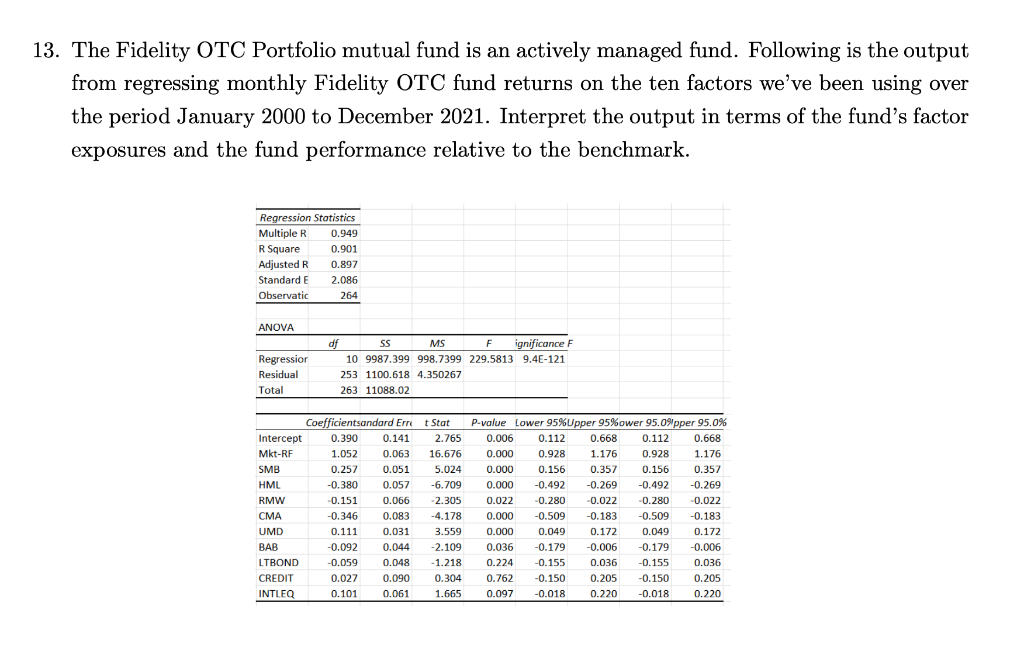
13. The Fidelity OTC Portfolio mutual fund is an actively managed fund. Following is the output from regressing monthly Fidelity OTC fund returns on the ten factors we've been using over the period January 2000 to December 2021. Interpret the output in terms of the fund's factor exposures and the fund performance relative to the benchmark. Regression Statistics Multiple R 0.949 R Square 0.901 Adjusted R 0.897 Standard E 2.086 Observatic 264 ANOVA Regression Residual Total df SS MS A ignificance F 10 9987.399 998.7399 229.5813 9.4E-121 253 1100.618 4.350267 263 11088.02 Coefficientsandard Erre Intercept 0.390 0.141 Mkt-RF 1.052 0.063 SMB 0.257 0.051 HML -0.380 0.057 RMW -0.151 0.066 CMA CIMA -0.346 0.083 UMD 0.111 0.031 BAB -0.092 0.044 LTBOND -0.059 0.048 CREDIT 0.027 0.090 INTLEQ 0.101 0.061 t Stat 2.765 16.676 5.024 -6.709 -2.305 -4.178 3.559 -2.109 - 1.218 0.304 1.665 P-value Lower 95%Upper 95%ower 95.0%pper 95.0% 0.006 0.112 0.668 0.112 0.668 0.000 0.928 1.176 0.928 1.176 0.000 0.156 0.357 0.156 0.357 0.000 -0.492 -0.269 -0.492 -0.269 0.022 -0.280 -0.022 -0.280 -0.022 0.000 -0.509 -0.509 0.000 0.049 0.172 0.049 0.172 0.036 -0.179 -0.006 -0.179 -0.006 0.224 -0.155 0.036 -0.155 0.036 0.762 -0.150 0.205 -0.150 0.205 0.097 -0.018 0.220 -0.018 0.220 -0.183 -0.183 13. The Fidelity OTC Portfolio mutual fund is an actively managed fund. Following is the output from regressing monthly Fidelity OTC fund returns on the ten factors we've been using over the period January 2000 to December 2021. Interpret the output in terms of the fund's factor exposures and the fund performance relative to the benchmark. Regression Statistics Multiple R 0.949 R Square 0.901 Adjusted R 0.897 Standard E 2.086 Observatic 264 ANOVA Regression Residual Total df SS MS A ignificance F 10 9987.399 998.7399 229.5813 9.4E-121 253 1100.618 4.350267 263 11088.02 Coefficientsandard Erre Intercept 0.390 0.141 Mkt-RF 1.052 0.063 SMB 0.257 0.051 HML -0.380 0.057 RMW -0.151 0.066 CMA CIMA -0.346 0.083 UMD 0.111 0.031 BAB -0.092 0.044 LTBOND -0.059 0.048 CREDIT 0.027 0.090 INTLEQ 0.101 0.061 t Stat 2.765 16.676 5.024 -6.709 -2.305 -4.178 3.559 -2.109 - 1.218 0.304 1.665 P-value Lower 95%Upper 95%ower 95.0%pper 95.0% 0.006 0.112 0.668 0.112 0.668 0.000 0.928 1.176 0.928 1.176 0.000 0.156 0.357 0.156 0.357 0.000 -0.492 -0.269 -0.492 -0.269 0.022 -0.280 -0.022 -0.280 -0.022 0.000 -0.509 -0.509 0.000 0.049 0.172 0.049 0.172 0.036 -0.179 -0.006 -0.179 -0.006 0.224 -0.155 0.036 -0.155 0.036 0.762 -0.150 0.205 -0.150 0.205 0.097 -0.018 0.220 -0.018 0.220 -0.183 -0.183
Step by Step Solution
There are 3 Steps involved in it

Get step-by-step solutions from verified subject matter experts