

Question: this is a House dataset with three attributes(price, lotsize, and stories). I want each of the stories' sizes 1,2,3, and 4 to be different
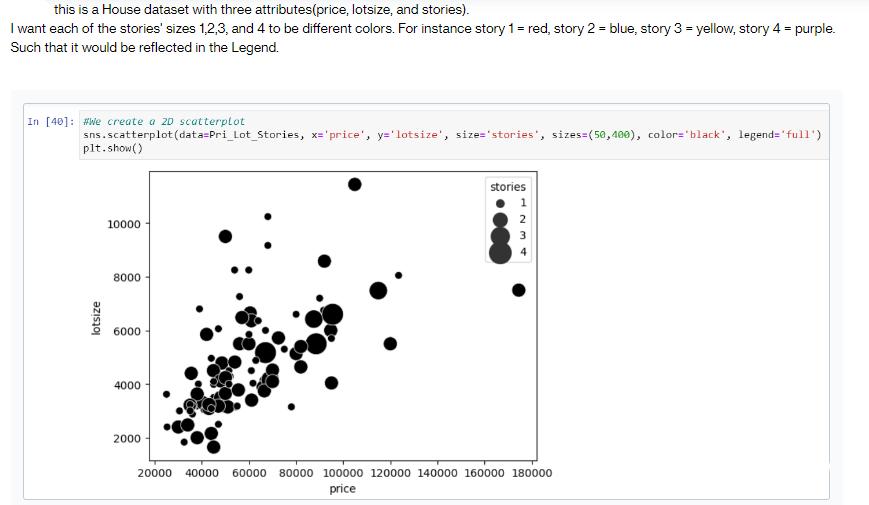
this is a House dataset with three attributes(price, lotsize, and stories). I want each of the stories' sizes 1,2,3, and 4 to be different colors. For instance story1 = red, story 2 = blue, story 3 = yellow, story 4 = purple. Such that it would be reflected in the Legend. In [40]: #We create a 2D scatterplot sns.scatterplot (data=Pri_Lot_Stories, x='price', y='lotsize', size='stories', sizes=(50,400), color='black', legend="full") plt.show() lotsize 10000 8000 6000 4000 2000 stories 20000 40000 60000 80000 100000 120000 140000 160000 180000 price
Step by Step Solution
3.48 Rating (151 Votes )
There are 3 Steps involved in it
To create a plot of the house dataset with one of a kind hues for every story length you could use P... View full answer

Get step-by-step solutions from verified subject matter experts