

Question: The scatterplot shows the age of students and the value of their cars according to the Kelley Blue Book. Does it show an increasing trend,
The scatterplot shows the age of students and the value of their cars according to the Kelley Blue Book. Does it show an increasing trend, a decreasing trend, or very little trend? Explain.
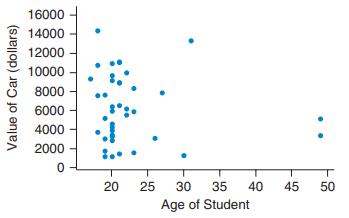
16000 14000 12000 10000 8000 6000 4000 2000 :.. 20 25 30 35 40 45 50 Age of Student Value of Car (dollars)
Step by Step Solution
★★★★★
3.46 Rating (169 Votes )
There are 3 Steps involved in it
1 Expert Approved Answer
Step: 1 Unlock

The points are ... View full answer
Question Has Been Solved by an Expert!
Get step-by-step solutions from verified subject matter experts
Step: 2 Unlock
Step: 3 Unlock