

Question: this is a Matlab Question Code from Problem 4: Write code to produce a graphical depiction of Newton's method like those shown in Figure 1.
this is a Matlab Question

Code from Problem 4:
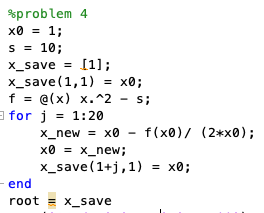
Write code to produce a graphical depiction of Newton's method like those shown in Figure 1. A reproduction like the one you should obtain is shown below 30 25 20 15 10 5 .5 10 5 6 This plot may look complicated, but it can be broken down many simple plot commands Begin your plotting code by clearing the figure and plotting the function and a horizontal line for the r-axis: clf hold on xs linspace (-1,6); plot (xs ,0*xs, 'k-'); % plot(xs,f (xs), 'b- x-axis Then add your code from Problem 4. Modify your code by adding a plot command to draw a red cross at the initial guess (ro,0). Then add plot commands within the loop to do each of the following at each iteration: 1. A dashed red line connecting the points (n,0) and (rn, f (xn)) 2. A red circle at the point (xn, f(xn)) 3. A red line connecting the points (rn, f xn and (xn+1,0) 4. A red cross at the point (xn+1,0) Save your figure to file as newton_babylon_iterations.png. %problem 4 x0 = 1. s=10; x_save[1]; xs a ve ( 1 , 1) = x0; f = @(x) X.^2 - s; for j = 1:20 x-new = x0 - f(x8)/ x0 = xnew; x-save ( 1+),1) = x0; (2*x8); - end root xsave
Step by Step Solution
There are 3 Steps involved in it

Get step-by-step solutions from verified subject matter experts