

Question: This is a matlab question! Problem 1.2 Create and upload a script by the name of Q1 2.m which displays the following two figures. These
This is a matlab question! 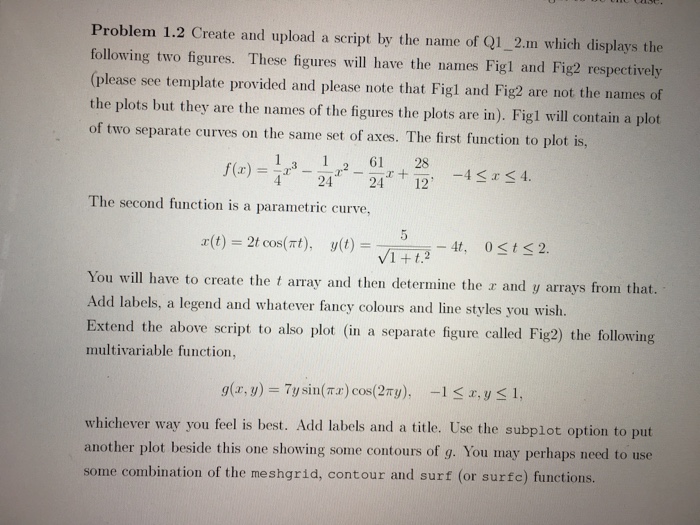
Problem 1.2 Create and upload a script by the name of Q1 2.m which displays the following two figures. These figures will have the names Figl and Fig2 respectively (please see template provided and please note that Figl and Fig2 are not the names of the plots but they are the names of the figures the plots are in). Figl will contain a plot of two separate curves on the same set of axes. The first function to plot is, 1 1 61 28 424 2412 The second function is a parametric curve, r(t) 2t cos(nt ), y(t) = 4t, 0
Step by Step Solution
There are 3 Steps involved in it
1 Expert Approved Answer
Step: 1 Unlock

Question Has Been Solved by an Expert!
Get step-by-step solutions from verified subject matter experts
Step: 2 Unlock
Step: 3 Unlock