

Question: This is a practical Exercise: the FlowChart given (as shown in the pdf file) illustrates a typical business-to-business functioning mechanism within a firm wherein an
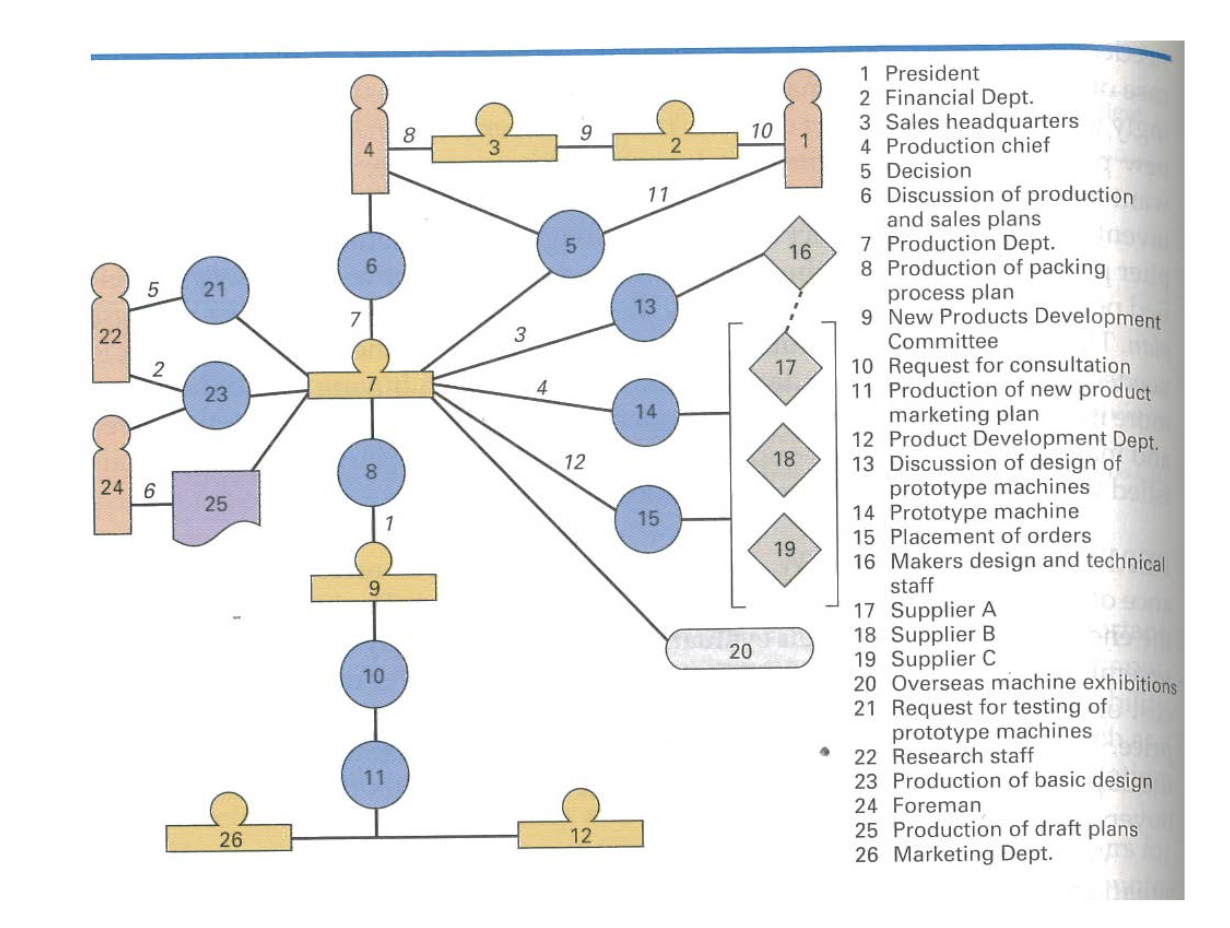
This is a practical Exercise: the FlowChart given (as shown in the pdf file) illustrates a typical business-to-business functioning mechanism within a firm wherein an organizational purchasing/buying/procurement scenario is shown.
The diagram shows different functional elements of the b2b process like the departments/personnel involved in information-sharing and decision-making, and the sequence of flow of work from beginning to end.
* Interpret the varied types of symbols used in the flowchart, along with their respective numbering within the symbols and along the lines.
* Explain in your own words the procurement and transactional process in place ---- by detailing (from beginning to end) how information is flowing and the respective roles of all departments (b2b functions) involved in the process.
HINT: The numbers in each box (as per varied symbols) represent the different people/departments/functional areas involved in the purchase decision, while the numbers along the lines represent the sequence of activities wherein the respective decision-makers are involved (that is, who communicates with whom, and at what stage in the b2b buying decision process) Further, to simplify a bit more so as to help you: this Exercise focuses on how b2b interactions occur between/among functional areas like purchase & procurement, production, research & development, design, branding, manufacturing, ordering & logistics, sales, etc.... ---- these functional areas are all tied into the marketing domain, or work closely with marketing. Say in your firm, your department/cell is working on something which is then passed on to another department/cell to build on, & so onward within the value chain. Hence, what you do & how well you do it serves as inputs to the next member who gets it from you. Thus, each cell in the work system influences others connected along the chain.
Comparing such interactions between working functions in the organization with classic buyer-seller transactions & relationships in the market is the objective of this exercise. What you do as the seller influences the many entities dealing with or connected with you as buyers; also, you too would be in this network as a buyer receiving from other sellers. Thus, the buyers and sellers in this exercise are actually the business functions exchanging work & information within the organization.
These inter-functional flows & effects within the b2b system are what this exercise demonstrates. Naturally since people & systems deal with the respective work functions & the information flows between different areas, the diagram shows that within the symbols & the flows - track that & explain it.
Step by Step Solution
There are 3 Steps involved in it

Get step-by-step solutions from verified subject matter experts