

Question: This is a Quality Control Question. Can you show step by step answers. Thanks in advance 3. (40 points) The quality engineers of a food
This is a Quality Control Question. Can you show step by step answers. Thanks in advance
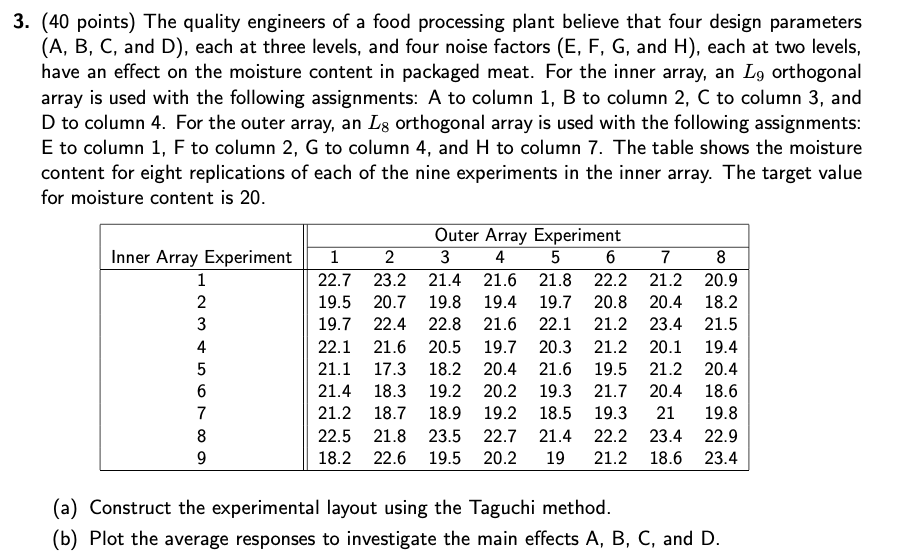
3. (40 points) The quality engineers of a food processing plant believe that four design parameters (A, B, C, and D), each at three levels, and four noise factors (E, F, G, and H), each at two levels, have an effect on the moisture content in packaged meat. For the inner array, an Lg orthogonal array is used with the following assignments: A to column 1, B to column 2, C to column 3, and D to column 4. For the outer array, an Lg orthogonal array is used with the following assignments: E to column 1, F to column 2, G to column 4, and H to column 7. The table shows the moisture content for eight replications of each of the nine experiments in the inner array. The target value for moisture content is 20. WN Inner Array Experiment 1 2 3 4 5 6 7 8 9 Outer Array Experiment 1 2 3 4 5 6 22.7 23.2 21.4 21.6 21.8 22.2 19.5 20.7 19.8 19.4 19.7 20.8 19.7 22.4 22.8 21.6 22.1 21.2 22.1 21.6 20.5 19.7 20.3 21.2 21.1 17.3 18.2 20.4 21.6 19.5 21.4 18.3 19.2 20.2 19.3 21.7 21.2 18.7 18.9 19.2 18.5 19.3 22.5 21.8 23.5 22.7 21.4 22.2 18.2 22.6 19.5 20.2 19 21.2 7 8 21.2 20.9 20.4 18.2 23.4 21.5 20.1 19.4 21.2 20.4 20.4 18.6 21 19.8 23.4 22.9 18.6 23.4 (a) Construct the experimental layout using the Taguchi method. (b) Plot the average responses to investigate the main effects A, B, C, and D. 3. (40 points) The quality engineers of a food processing plant believe that four design parameters (A, B, C, and D), each at three levels, and four noise factors (E, F, G, and H), each at two levels, have an effect on the moisture content in packaged meat. For the inner array, an Lg orthogonal array is used with the following assignments: A to column 1, B to column 2, C to column 3, and D to column 4. For the outer array, an Lg orthogonal array is used with the following assignments: E to column 1, F to column 2, G to column 4, and H to column 7. The table shows the moisture content for eight replications of each of the nine experiments in the inner array. The target value for moisture content is 20. WN Inner Array Experiment 1 2 3 4 5 6 7 8 9 Outer Array Experiment 1 2 3 4 5 6 22.7 23.2 21.4 21.6 21.8 22.2 19.5 20.7 19.8 19.4 19.7 20.8 19.7 22.4 22.8 21.6 22.1 21.2 22.1 21.6 20.5 19.7 20.3 21.2 21.1 17.3 18.2 20.4 21.6 19.5 21.4 18.3 19.2 20.2 19.3 21.7 21.2 18.7 18.9 19.2 18.5 19.3 22.5 21.8 23.5 22.7 21.4 22.2 18.2 22.6 19.5 20.2 19 21.2 7 8 21.2 20.9 20.4 18.2 23.4 21.5 20.1 19.4 21.2 20.4 20.4 18.6 21 19.8 23.4 22.9 18.6 23.4 (a) Construct the experimental layout using the Taguchi method. (b) Plot the average responses to investigate the main effects A, B, C, and DStep by Step Solution
There are 3 Steps involved in it
1 Expert Approved Answer
Step: 1 Unlock

Question Has Been Solved by an Expert!
Get step-by-step solutions from verified subject matter experts
Step: 2 Unlock
Step: 3 Unlock