

Question: this is a question about investment research method, this table combined high value with high momentum and high value with low momentum, etc. I want
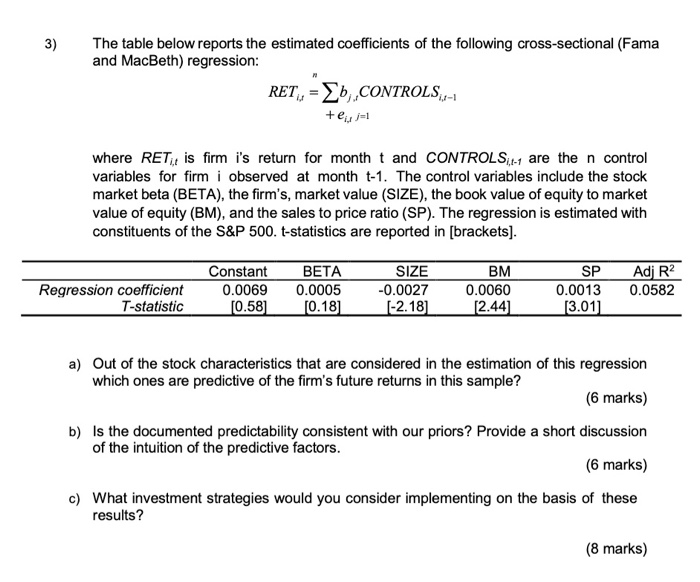
3) The table below reports the estimated coefficients of the following cross-sectional (Fama and MacBeth) regression: RET, = {b.CONTROLS,- + ej=1 where RET, is firm i's return for month t and CONTROLS 1-1 are the n control variables for firm i observed at month t-1. The control variables include the stock market beta (BETA), the firm's, market value (SIZE), the book value of equity to market value of equity (BM), and the sales to price ratio (SP). The regression is estimated with constituents of the S&P 500. t-statistics are reported in [brackets). Constant 0.0069 [0.58] Regression coefficient T-statistic BETA 0.0005 (0.18] SIZE -0.0027 [-2.18] BM 0.0060 (2.44) SP 0.0013 (3.01] Adj R2 0.0582 1 a) Out of the stock characteristics that are considered in the estimation of this regression which ones are predictive of the firm's future returns in this sample? (6 marks) b) is the documented predictability consistent with our priors? Provide a short discussion of the intuition of the predictive factors. (6 marks) c) What investment strategies would you consider implementing on the basis of these results? (8 marks) 3) The table below reports the estimated coefficients of the following cross-sectional (Fama and MacBeth) regression: RET, = {b.CONTROLS,- + ej=1 where RET, is firm i's return for month t and CONTROLS 1-1 are the n control variables for firm i observed at month t-1. The control variables include the stock market beta (BETA), the firm's, market value (SIZE), the book value of equity to market value of equity (BM), and the sales to price ratio (SP). The regression is estimated with constituents of the S&P 500. t-statistics are reported in [brackets). Constant 0.0069 [0.58] Regression coefficient T-statistic BETA 0.0005 (0.18] SIZE -0.0027 [-2.18] BM 0.0060 (2.44) SP 0.0013 (3.01] Adj R2 0.0582 1 a) Out of the stock characteristics that are considered in the estimation of this regression which ones are predictive of the firm's future returns in this sample? (6 marks) b) is the documented predictability consistent with our priors? Provide a short discussion of the intuition of the predictive factors. (6 marks) c) What investment strategies would you consider implementing on the basis of these results? (8 marks)
Step by Step Solution
There are 3 Steps involved in it

Get step-by-step solutions from verified subject matter experts