

Question: this is a question from Applied Strategic Decision Making class . QUESTION 1 The following questions will refer to this figure. Low Cost Advantage Figure
this is a question from Applied Strategic Decision Making class .
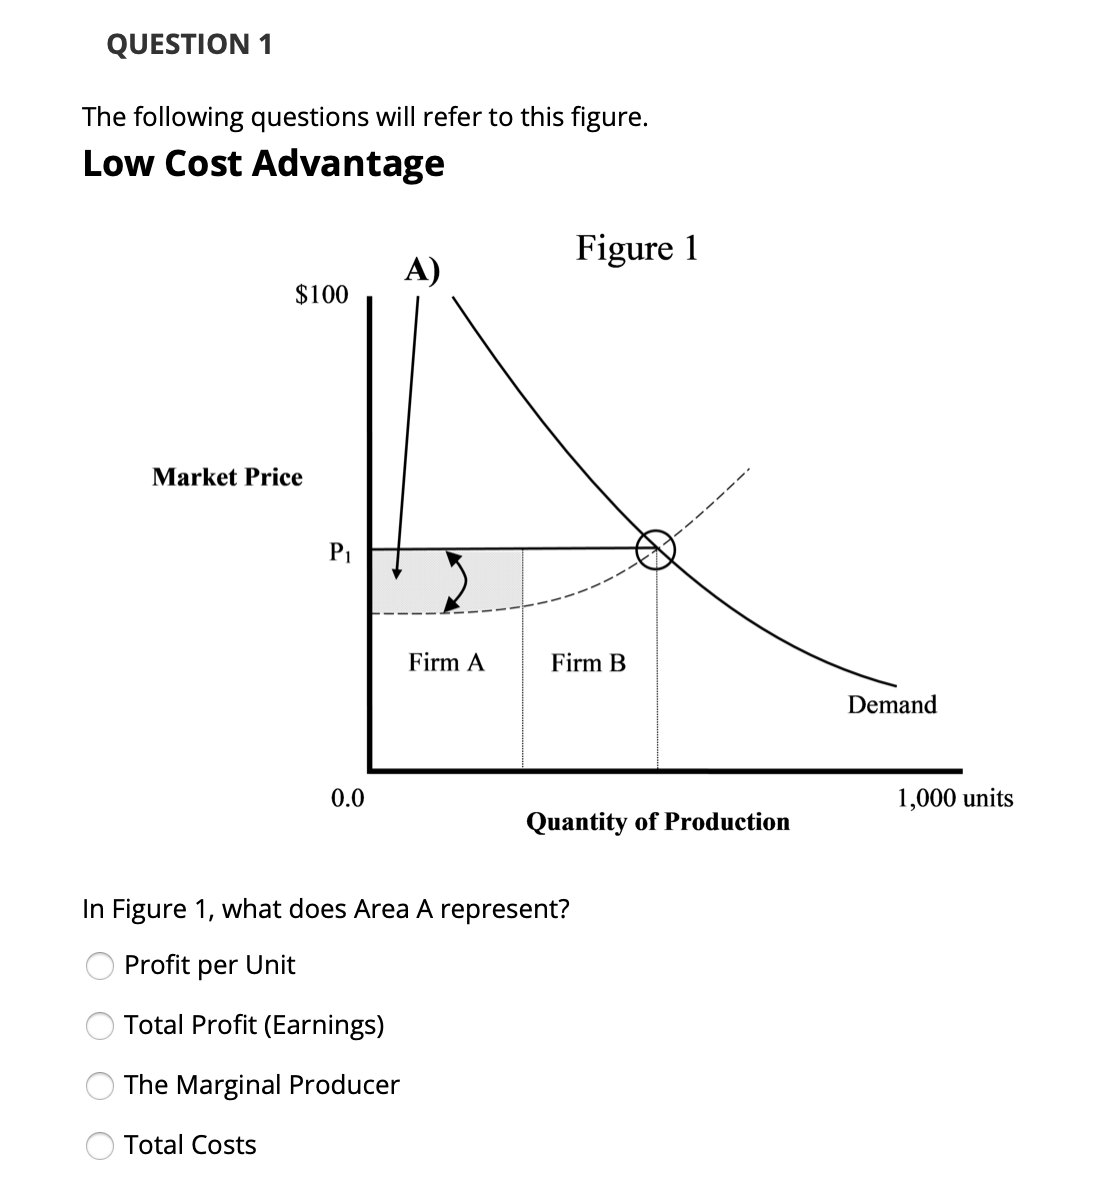
QUESTION 1 The following questions will refer to this figure. Low Cost Advantage Figure 1 $100 A) Market Price P1 Firm A Firm B Demand 0.0 Quantity of Production 1,000 units In Figure 1, what does Area A represent? Profit per Unit Total Profit (Earnings) The Marginal Producer Total Costs
Step by Step Solution
There are 3 Steps involved in it
1 Expert Approved Answer
Step: 1 Unlock

Question Has Been Solved by an Expert!
Get step-by-step solutions from verified subject matter experts
Step: 2 Unlock
Step: 3 Unlock