

Question: This is a R class so write code Thank you 1. In the following data with 12 subjects, the first column is a sex
This is a R class so write code Thank you
\
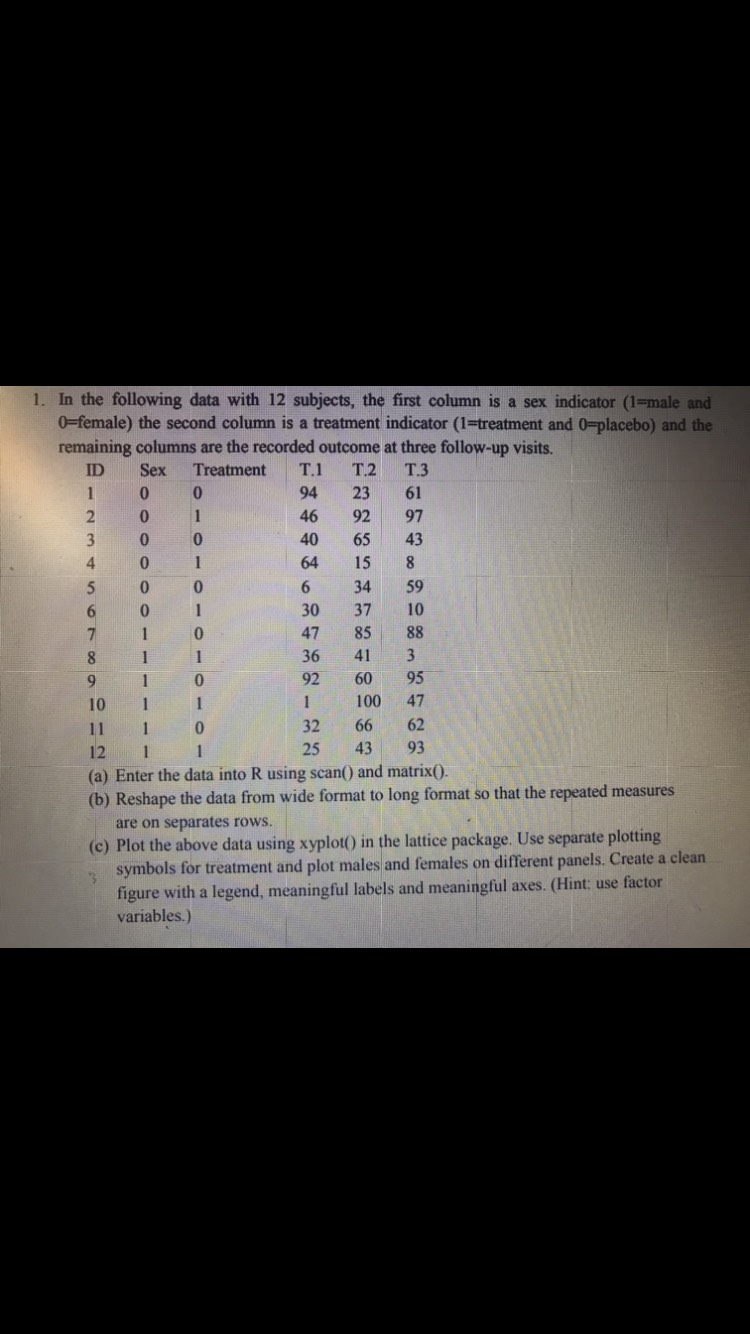
1. In the following data with 12 subjects, the first column is a sex indicator (1=male and 0=female) the second column is a treatment indicator (1=treatment and 0=placebo) and the remaining columns are the recorded outcome at three follow-up visits. ID Sex Treatment T.1 T.2 T.3 O O - C 94 23 61 0 46 92 97 40 65 43 64 15 8 6 34 59 w 885 95 1 100 47 32 66 62 12 25 43 93 (a) Enter the data into R using scan() and matrix(). (b) Reshape the data from wide format to long format so that the repeated measures are on separates rows. (c) Plot the above data using xyplot() in the lattice package. Use separate plotting 3 symbols for treatment and plot males and females on different panels. Create a clean figure with a legend, meaningful labels and meaningful axes. (Hint: use factor variables.)
Step by Step Solution
There are 3 Steps involved in it

Get step-by-step solutions from verified subject matter experts