

Question: this is a rate diagram problem this is a rate diagram problem this is a rate diagram problem this is a rate diagram problem this
this is a rate diagram problem this is a rate diagram problem this is a rate diagram problem this is a rate diagram problem this is a rate diagram problem this is a rate diagram problem this is a rate diagram problem
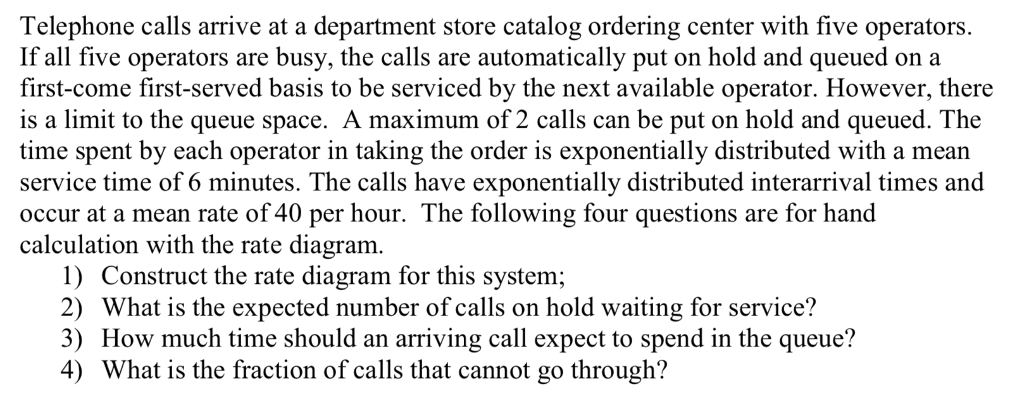
Telephone calls arrive at a department store catalog ordering center with five operators. If all ve operators are busy, the calls are automatically put on hold and queued on a rst-come rst-served basis to be serviced by the next available operator. However, there is a limit to the queue space. A maximum of 2 calls can be put on hold and queued. The time spent by each operator in taking the order is exponentially distributed with a mean service time of 6 minutes. The calls have exponentially distributed interarrival times and occur at a mean rate of 40 per hour. The following four questions are for hand calculation with the rate diagram. 1) Construct the rate diagram for this system; 2) What is the expected number of calls on hold waiting for service? 3) How much time should an arriving call expect to spend in the queue? 4) What is the fraction of calls that cannot go through
Step by Step Solution
There are 3 Steps involved in it

Get step-by-step solutions from verified subject matter experts