

Question: This is a survival analysis question. The numbers below represent the survival times in years for two groups with a rare disease. The values with
This is a survival analysis question. The numbers below represent the survival times in years for two groups with a rare disease. The values with (+) are censored.
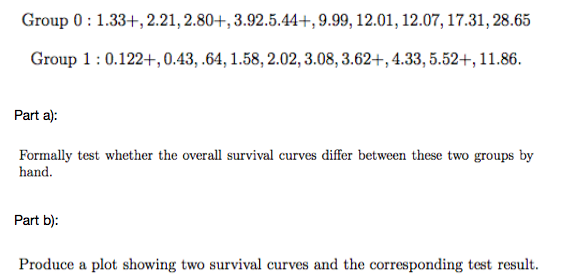
Group 0 : 1.33+, 2.21, 2.80+, 3.92.5.44+, 9.99, 12.01, 12.07, 17.31, 28.65 Group 1 : 0.122+, 0.43, .64, 1.58, 2.02, 3.08, 3.62+, 4.33, 5.52+, 11.86. Part a): Formally test whether the overall survival curves differ between these two groups by hand. Part b): Produce a plot showing two survival curves and the corresponding test result
Step by Step Solution
There are 3 Steps involved in it
1 Expert Approved Answer
Step: 1 Unlock

Question Has Been Solved by an Expert!
Get step-by-step solutions from verified subject matter experts
Step: 2 Unlock
Step: 3 Unlock