

Question: This is an applied survival analysis. The numbers below represent the survival times in years for two groups with a rare disease. The values with
This is an applied survival analysis. The numbers below represent the survival times in years for two groups with a rare disease. The values with (+) are censored.
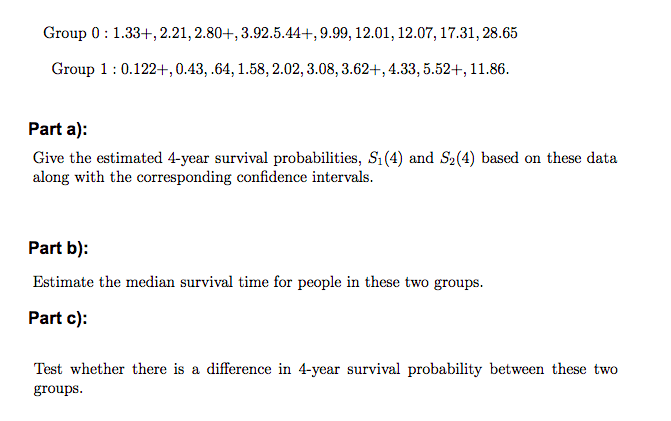
Group 0 : 1.33+, 2.21, 2.80+, 3.92.5.44+, 9.99, 12.01, 12.07, 17.31, 28.65 Group 1 : 0.122+, 0.43, .64, 1.58, 2.02, 3.08, 3.62+, 4.33, 5.52+, 11.86. Part a): Give the estimated 4-year survival probabilities, S1(4) and S2(4) based on these data along with the corresponding confidence intervals. Part b): Estimate the median survival time for people in these two groups. Part c): Test whether there is a difference in 4-year survival probability between these two groups
Step by Step Solution
There are 3 Steps involved in it

Get step-by-step solutions from verified subject matter experts