

Question: THIS IS A THREE PART QUESTIONS. ....... Consider the following table showing speed limits and death rates from automobile accidents in selected countries. Complete parts
THIS IS A THREE PART QUESTIONS. .......
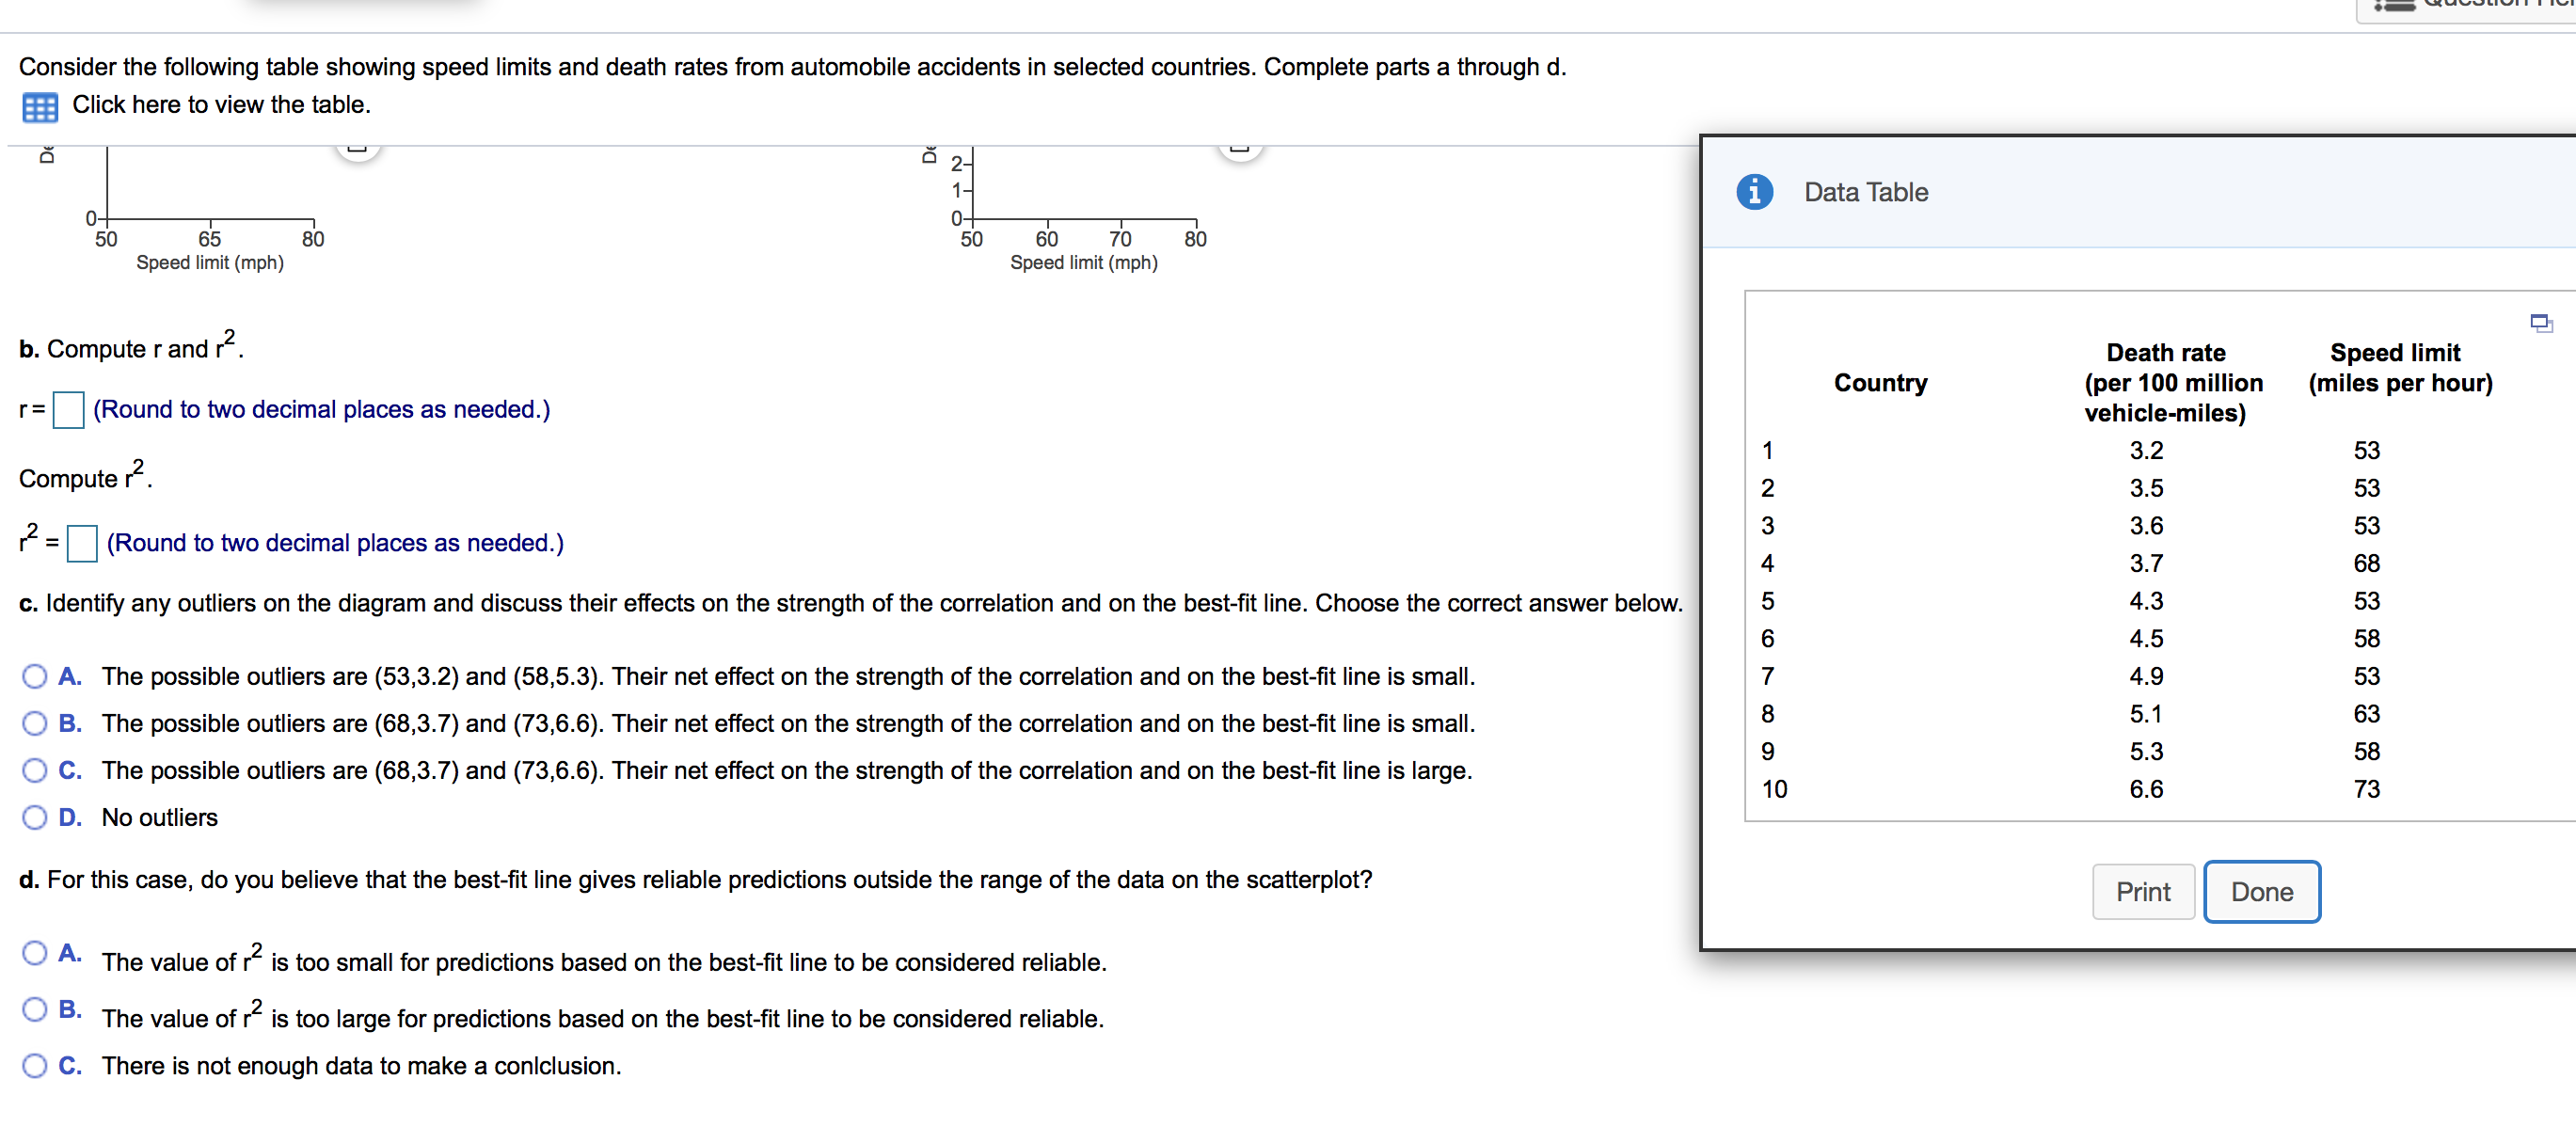
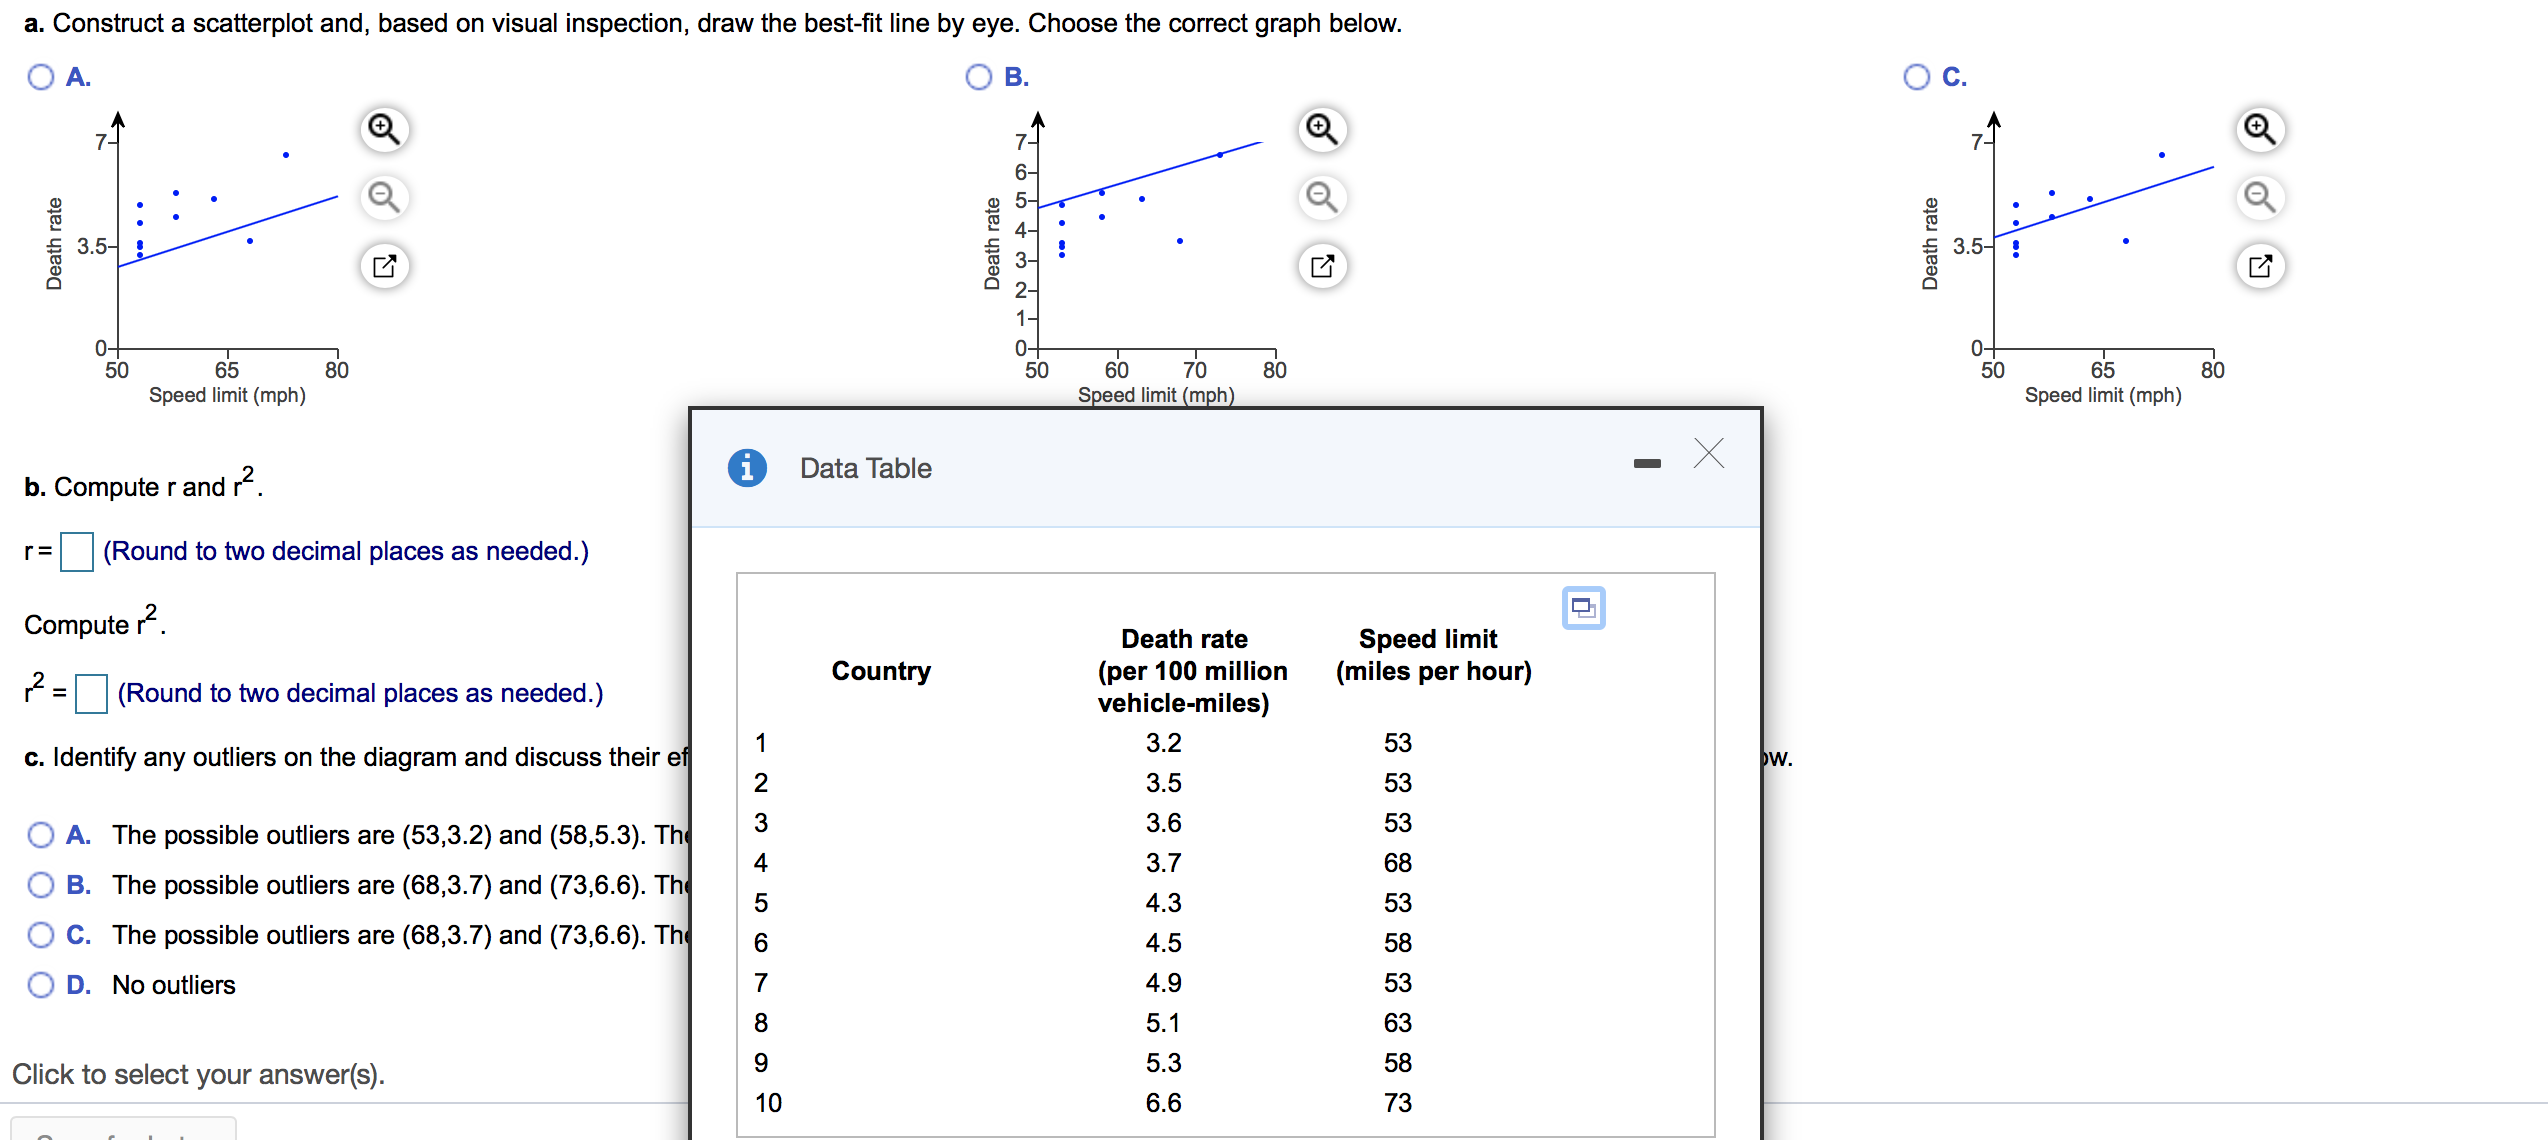
Consider the following table showing speed limits and death rates from automobile accidents in selected countries. Complete parts a through d. a Click here to view the table. a 5 z 1 0 Data Table 0 0 50 65 80 50 60 7o 60 Speed limit (mph) Speed limit (mph) la b- Compute rand r2- Death rate Speed limit Country (per 100 million (miles per hour) r= (Round to two decimal places as needed.) vehicle-miles) 1 3.2 53 Compute r2. 2 3'5 53 r2 = (Round to two decimal places as needed.) 3 3'6 53 4 3.7 68 1:. Identify any outtiers on the diagram and discuss their effects on the strength of the correlation and on the best-t line. Choose the correct answer below. 5 4.3 53 6 4.5 58 O A. The possible outliers are (53.3.2) and (58.5.3). Their net effect on the strength of the correlation and on the best-t line is small. 7 4.9 53 O B. The possible outliers are (68.37) and (73.6.6). Their net effect on the strength of the correlation and on the best-t line is small. 8 5-1 63 9 5.3 58 O c. The possible outliers are (68.3.7) and (73.6.6). Their net effect on the strength of the correlation and on the best-t line is large. 10 6 6 73 O D. No outliers I d. For this case, do you believe that the best-t line gives reliable predictions outside the range of the data on the scatterplot'? O A' The value of r2 is too small for predictions based on the best-t line to be considered reliable. O B' The value of r2 is too large for predictions based on the best-fit line to be considered reliable. O C. There is not enough data to make a conlclusion. a. Construct a scatterplot and, based on visual inspection, draw the best-fit line by eye. Choose the correct graph below. O A. O B. O C. 7- Death rate 97NWAGOT 7 _ Death rate 3.5- . . Death rate 3.5- 0+ 50 65 80 50 60 70 80 50 65 80 Speed limit (mph) Speed limit (mph) Speed limit (mph) b. Computer and r2. i Data Table - X r= (Round to two decimal places as needed.) Computer . Death rate Speed limit 12 =(Round to two decimal places as needed.) Country (per 100 million (miles per hour) vehicle-miles) c. Identify any outliers on the diagram and discuss their ef A W N - 3.2 53 pw. 3.5 53 O A. The possible outliers are (53,3.2) and (58,5.3). The 3.6 53 O B. The possible outliers are (68,3.7) and (73,6.6). The 3.7 68 4.3 53 O C. The possible outliers are (68,3.7) and (73,6.6). The 4.5 58 O D. No outliers 4.9 53 5.1 63 Click to select your answer(s). 5.3 58 10 6.6 73
Step by Step Solution
There are 3 Steps involved in it

Get step-by-step solutions from verified subject matter experts