

Question: Safe Speeds? Consider the following table showing speed limits and death rates from automobile accidents in selected countries. a. Construct a scatterplot of the data.
Safe Speeds? Consider the following table showing speed limits and death rates from automobile accidents in selected countries.
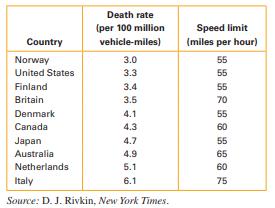
a. Construct a scatterplot of the data.
b. Briefly characterize the correlation in words (for example, strong positive correlation, weak negative correlation) and estimate the correlation coefficient of the data.
(Or calculate the correlation coefficient exactly with the aid of a calculator or software.)
c. In the newspaper, these data were presented in an article titled “Fifty-five mph speed limit is no safety guarantee.” Based on the data, do you agree with this claim? Explain.
Country Death rate (per 100 million vehicle-miles) Speed limit (miles per hour) Norway 3.0 55 United States 3.3 55 Finland 3.4 55 Britain 3.5 70 Denmark 4.1 55 Canada 4.3 60 Japan 4.7 55 Australia 4.9 65 Netherlands 5.1 60 Italy 6.1 75 Source: D. J. Rivkin, New York Times.
Step by Step Solution
There are 3 Steps involved in it

Get step-by-step solutions from verified subject matter experts