

Question: this is all C. Const assignable causes pres LE 3.3 OUNCES OF CAULKING TUBE NUMBER ple 1 2 3 5 8 7 7.98 834 802
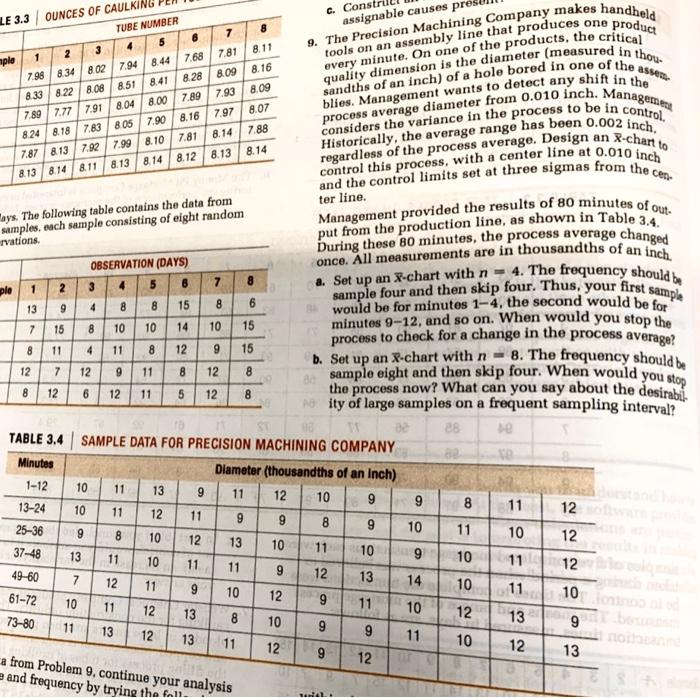
C. Const assignable causes pres LE 3.3 OUNCES OF CAULKING TUBE NUMBER ple 1 2 3 5 8 7 7.98 834 802 7.948.44 7.68 7.81 8.11 8.33 8.22 8.08 8.51 8.41 8.28 8.09 8.16 7.897.777.91 8.048.00 7.93 8.09 8.248.187.83 805 7.90 8.16 7.97 8.07 7.87 813 7.2 7.99 8.10 7.81 8.14 7.88 8.13 8.14 8.11 8.13 8.14 8.128.13 8.14 7.89 X-chart to 9. The Precision Machining Company makes handheld tools on an assembly line that produces one product every minute. On one of the products, the critical quality dimension is the diameter (measured in those sandths of an inch) of a hole bored in one of the asset blies. Management wants to detect any shift in the considers the variance in the process to be in control, process average diameter from 0.010 inch. Management Historically, the average range has been 0.002 inch, regardless of the process average. Design an control this process, with a center line at 0.010 inch and the control limits set at three sigmas from the cen ter line. Management provided the results of 80 minutes of out put from the production line, as shown in Table 3.4. During these 80 minutes, the process average changed once. All measurements are in thousandths of an inch. a. Set up an X-chart with n=4. The frequency should be sample four and then skip four. Thus, your first sample Mays. The following table contains the data from samples, each sample consisting of eight random rvations ple 1 8 6 13 9 12 7 9 8 8 OBSERVATION (DAYS) 7 8 2 3 4 5 6 9 4 8 8 15 would be for minutes 1-4, the second would be for 7 15 8 10 10 14 minutes 9-12, and so on. When would you stop the 10 15 process to check for a change in the process average? 8 11 4 11 8 12 15 b. Set up an X-chart with n = 8. The frequency should be 12 11 8 12 8 the process now? What can you say about the desirabil 12 6 12 11 5 12 8 ity of large samples on a frequent sampling interval? 28 De TABLE 3.4 SAMPLE DATA FOR PRECISION MACHINING COMPANY VO Minutes Diameter (thousandths of an inch) 1-12 10 11 13 9 11 12 10 9 8 11 10 11 12 12 11 9 9 8 9 25-36 10 11 9 8 10 10 12 12 13 10 11 10 13 9 11 10 10 11 11 11 12 9 12 7 13 12 14 11 10 9 10 11 12 10 9 11 11 12 10 13 12 8 10 13 9 9 13 9 12 13 11 11 10 12 12 13 12 9 9 13-24 8 37-48 49-60 61-72 73-80 10 9 a from Problem 9, continue your analysis and frequency by trying the fall C. Const assignable causes pres LE 3.3 OUNCES OF CAULKING TUBE NUMBER ple 1 2 3 5 8 7 7.98 834 802 7.948.44 7.68 7.81 8.11 8.33 8.22 8.08 8.51 8.41 8.28 8.09 8.16 7.897.777.91 8.048.00 7.93 8.09 8.248.187.83 805 7.90 8.16 7.97 8.07 7.87 813 7.2 7.99 8.10 7.81 8.14 7.88 8.13 8.14 8.11 8.13 8.14 8.128.13 8.14 7.89 X-chart to 9. The Precision Machining Company makes handheld tools on an assembly line that produces one product every minute. On one of the products, the critical quality dimension is the diameter (measured in those sandths of an inch) of a hole bored in one of the asset blies. Management wants to detect any shift in the considers the variance in the process to be in control, process average diameter from 0.010 inch. Management Historically, the average range has been 0.002 inch, regardless of the process average. Design an control this process, with a center line at 0.010 inch and the control limits set at three sigmas from the cen ter line. Management provided the results of 80 minutes of out put from the production line, as shown in Table 3.4. During these 80 minutes, the process average changed once. All measurements are in thousandths of an inch. a. Set up an X-chart with n=4. The frequency should be sample four and then skip four. Thus, your first sample Mays. The following table contains the data from samples, each sample consisting of eight random rvations ple 1 8 6 13 9 12 7 9 8 8 OBSERVATION (DAYS) 7 8 2 3 4 5 6 9 4 8 8 15 would be for minutes 1-4, the second would be for 7 15 8 10 10 14 minutes 9-12, and so on. When would you stop the 10 15 process to check for a change in the process average? 8 11 4 11 8 12 15 b. Set up an X-chart with n = 8. The frequency should be 12 11 8 12 8 the process now? What can you say about the desirabil 12 6 12 11 5 12 8 ity of large samples on a frequent sampling interval? 28 De TABLE 3.4 SAMPLE DATA FOR PRECISION MACHINING COMPANY VO Minutes Diameter (thousandths of an inch) 1-12 10 11 13 9 11 12 10 9 8 11 10 11 12 12 11 9 9 8 9 25-36 10 11 9 8 10 10 12 12 13 10 11 10 13 9 11 10 10 11 11 11 12 9 12 7 13 12 14 11 10 9 10 11 12 10 9 11 11 12 10 13 12 8 10 13 9 9 13 9 12 13 11 11 10 12 12 13 12 9 9 13-24 8 37-48 49-60 61-72 73-80 10 9 a from Problem 9, continue your analysis and frequency by trying the fall
Step by Step Solution
There are 3 Steps involved in it

Get step-by-step solutions from verified subject matter experts