

Question: this is all one question, using the same table (need the slope, intercept, and forecast) Looking at the data in the table above, what is
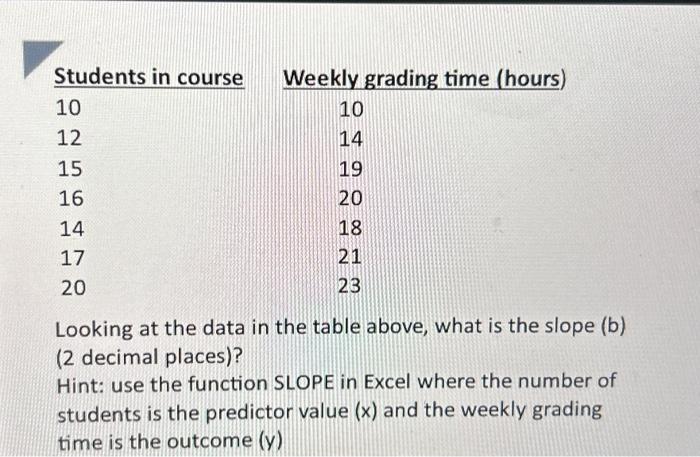
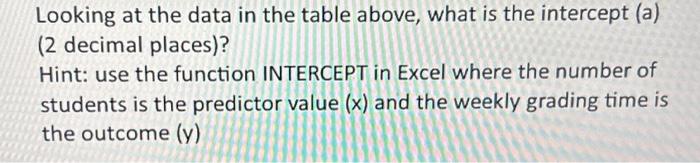
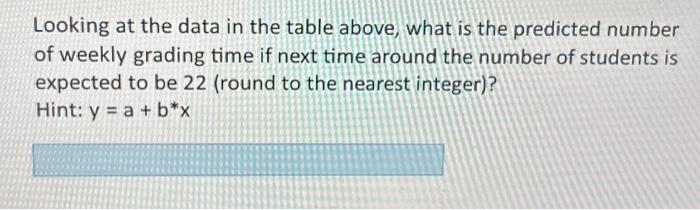
Looking at the data in the table above, what is the slope (b) ( 2 decimal places)? Hint: use the function SLOPE in Excel where the number of students is the predictor value (x) and the weekly grading time is the outcome (y) Looking at the data in the table above, what is the intercept (a) (2 decimal places)? Hint: use the function INTERCEPT in Excel where the number of students is the predictor value (x) and the weekly grading time is the outcome (y) Looking at the data in the table above, what is the predicted number of weekly grading time if next time around the number of students is expected to be 22 (round to the nearest integer)? Hint: y=a+bx Looking at the data in the table above, what is the slope (b) ( 2 decimal places)? Hint: use the function SLOPE in Excel where the number of students is the predictor value (x) and the weekly grading time is the outcome (y) Looking at the data in the table above, what is the intercept (a) (2 decimal places)? Hint: use the function INTERCEPT in Excel where the number of students is the predictor value (x) and the weekly grading time is the outcome (y) Looking at the data in the table above, what is the predicted number of weekly grading time if next time around the number of students is expected to be 22 (round to the nearest integer)? Hint: y=a+bx
Step by Step Solution
There are 3 Steps involved in it

Get step-by-step solutions from verified subject matter experts