

Question: this is american eagle 10-K i just need help on the spring buget please. the last picture is the directions. pls help me FY 2018
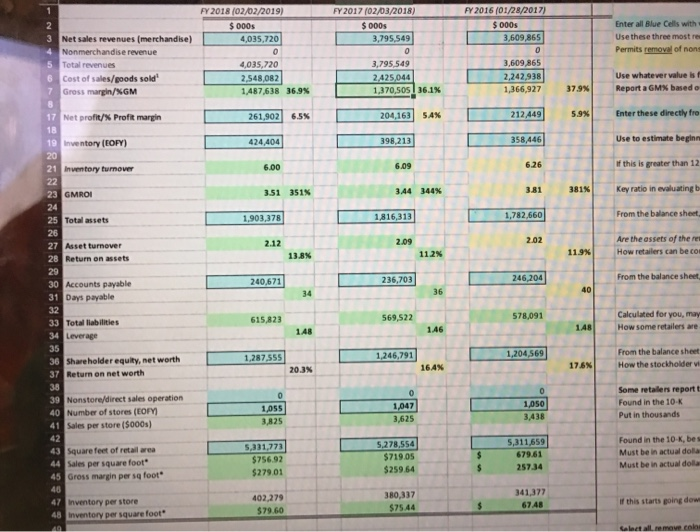
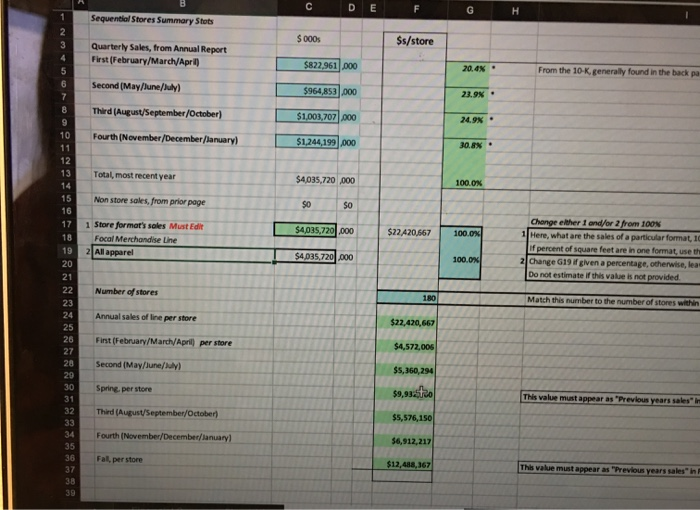
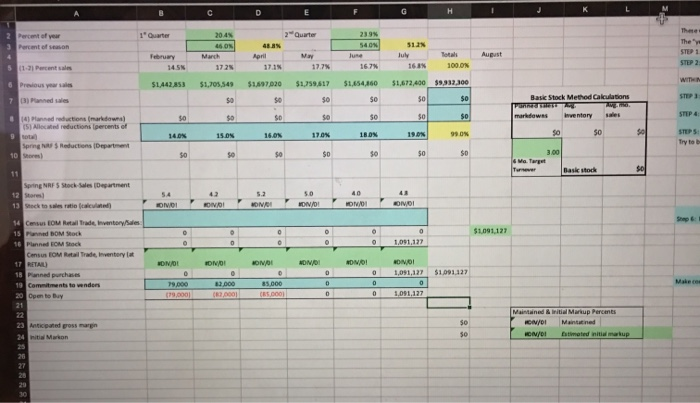
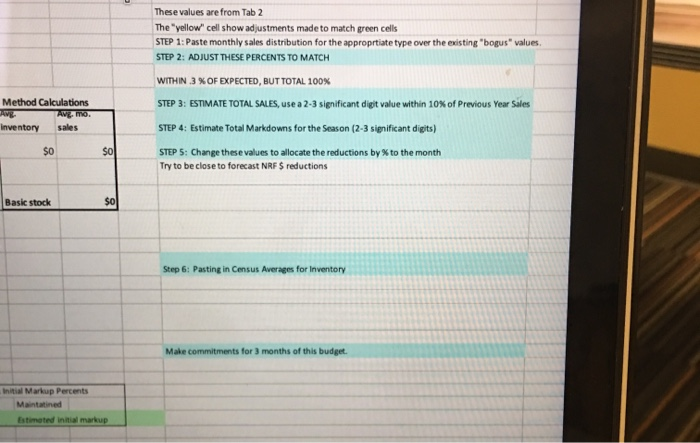
FY 2018 (02/02/2019) S000s 4,035,720 FY 2017 02/03/ 2018) $ 0005 3,795,549 FY 2016 (01/28/2017) 5000s 3,609,865 Enter all Blue Cells with Use these three mostres Permits removal of nons 3 Net sales revenues (merchandise 4 Nonmerchandise revenue 5 Total revenues 6 Cost of sales/goods sold 7 Gross margin/XGM 4,035,720 2,548,082 1,487,638 36.9% 3,795,549 2425.044 1,370,505 36.1% 3.609.865 2,242,938 1,366,927 Use whatever value is Report a GMX based o 37.9% 17 Net profit/% Profit margin 261,902 6.5% 204,163 54% 212,449 5.9% Enter these directly fro 19 Inventory (EOFY) 424 404 398,213 358,446 Use to estimate beginn 21 Inventory turnover 6.00 6.09 626 If this is greater than 12 3.51 351% GMROI 3.44 381% & NSNN 344% Key ratio in evaluating 25 Total assets 1.903,378 1,816,313 1,782,660 From the balance sheet 2.12 209 2.02 Asset turnover Return on assets Are the assets of the res How retailers can be con 13.8% 112% 236,703 240,671 From the balance sheet 246,204 Accounts payable 31 Days payable 34 36 615.823 569,522 578,091 33 Total liabilities 34 Leverage Calculated for you, may How some retailers are 1.48 1.46 1,204,569 1.246,791 1.287.555 36 Shareholder equity, net worth 37 Return on net worth From the balance sheet How the stockholder 175N 20.3% 39 Nonstore/direct sales operation 40 Number of stores (EOFY 41 Sales per store (5000s) 1047 1,055 Some retailers report Found in the 10-K Put in thousands 1,050 3.438 3,825 3,625 43 square feet of retail area 44 Sales per square foot 45 Gross margin per sq foot 5,331,773 $756.92 $279.01 5.278,554 $719.05 $259.64 5,311,659 679.61 257.34 Found in the 10 K, bes Must be in actual dola Must be in actual dolla 402,279 $79.60 380,337 $7544 341,377 67 AR 47 Inventory per store 48 Inventory per square foot If this starts going dow Select all remove colo Sequential Stores Summary Stots $ 000 $s/store Quarterly Sales, from Annual Report First (February/March/April) $822,961.000 20.4% From the 10-K, generally found in the back pa Second (May/June/July) $964,853.000 22.9% NO ON Third (August/September October) $1,003,707.000 24.9% Fourth (November December/lanuary) $1,244,199,000 30.8% Total, most recent year $4,035,720 000 100.0% Non store sales, from prior page $0 $0 $4,035,720.000 $22.420,667 1 Store format's soles Must Edit Focal Merchandise Line 2. All apparel 100.0% Change ether I and/or 2 from 100% 1 Here, what are the sales of a particular format, 10 If percent of square feet are in one format, use th 2 Change 619 if given a percentage, otherwise, lea Do not estimate if this value is not provided $4,035,720.000 100.0% Number of stores 180 Match this number to the number of stores within Annual sales of line per store $22,420,667 First (February/March/April) per store $4,572,005 Second (May/June/Y) $5,360,294 Spring, per store $9,9350 This value must appear as "Previous years sales Third (August September/October) $5,576,150 Fourth (November/December/anuary] $6,912,217 Fal, per store $12,488,367 This value must appear as "Previous years sales in Quarter 23 Percent of season February STEP 1 11. Percent Previous $1443 5 1.705549 $ 1 7020 1.59.617 $1,654,160 $1,672,400 39,832,300 Bank Stock Method Calculations entory s STEP 4 14 15.0 15.0 170 180 50 $ Speg N oches D ent 13 Warta 14 C OM Retrade, inventory 15 BOM Stock 10 M COM KON O NI NA ONO OMOI ON $1.091127 10 Ca t enders 20 Cent Buy 19.000 179.000 2 000 2.000 00 . 0 0 0 0 1081127 Mandi Mp Percent V/0! Manned 23 Ante poss margin 24 Marko These values are from Tab 2 The "yellow cell show adjustments made to match green cells STEP 1: Paste monthly sales distribution for the appropriate type over the existing "bogus' values STEP 2: ADJUST THESE PERCENTS TO MATCH WITHIN 3 % OF EXPECTED, BUT TOTAL 100% STEP 3: ESTIMATE TOTAL SALES, use a 2-3 significant digit value within 10% of Previous Year Sales Method Calculations AVE.mo. Inventory sales STEP 4: Estimate Total Markdowns for the Season (2-3 significant digits) $0 $0 to the month STEP 5: Change these values to allocate the reductions by Try to be close to forecast NRF $ reductions Basic stock Step 6: Pasting in Census Averages for Inventory Make commitments for 3 months of this budget. Initial Markup Percents Maintained Estimated in tal markup FY 2018 (02/02/2019) S000s 4,035,720 FY 2017 02/03/ 2018) $ 0005 3,795,549 FY 2016 (01/28/2017) 5000s 3,609,865 Enter all Blue Cells with Use these three mostres Permits removal of nons 3 Net sales revenues (merchandise 4 Nonmerchandise revenue 5 Total revenues 6 Cost of sales/goods sold 7 Gross margin/XGM 4,035,720 2,548,082 1,487,638 36.9% 3,795,549 2425.044 1,370,505 36.1% 3.609.865 2,242,938 1,366,927 Use whatever value is Report a GMX based o 37.9% 17 Net profit/% Profit margin 261,902 6.5% 204,163 54% 212,449 5.9% Enter these directly fro 19 Inventory (EOFY) 424 404 398,213 358,446 Use to estimate beginn 21 Inventory turnover 6.00 6.09 626 If this is greater than 12 3.51 351% GMROI 3.44 381% & NSNN 344% Key ratio in evaluating 25 Total assets 1.903,378 1,816,313 1,782,660 From the balance sheet 2.12 209 2.02 Asset turnover Return on assets Are the assets of the res How retailers can be con 13.8% 112% 236,703 240,671 From the balance sheet 246,204 Accounts payable 31 Days payable 34 36 615.823 569,522 578,091 33 Total liabilities 34 Leverage Calculated for you, may How some retailers are 1.48 1.46 1,204,569 1.246,791 1.287.555 36 Shareholder equity, net worth 37 Return on net worth From the balance sheet How the stockholder 175N 20.3% 39 Nonstore/direct sales operation 40 Number of stores (EOFY 41 Sales per store (5000s) 1047 1,055 Some retailers report Found in the 10-K Put in thousands 1,050 3.438 3,825 3,625 43 square feet of retail area 44 Sales per square foot 45 Gross margin per sq foot 5,331,773 $756.92 $279.01 5.278,554 $719.05 $259.64 5,311,659 679.61 257.34 Found in the 10 K, bes Must be in actual dola Must be in actual dolla 402,279 $79.60 380,337 $7544 341,377 67 AR 47 Inventory per store 48 Inventory per square foot If this starts going dow Select all remove colo Sequential Stores Summary Stots $ 000 $s/store Quarterly Sales, from Annual Report First (February/March/April) $822,961.000 20.4% From the 10-K, generally found in the back pa Second (May/June/July) $964,853.000 22.9% NO ON Third (August/September October) $1,003,707.000 24.9% Fourth (November December/lanuary) $1,244,199,000 30.8% Total, most recent year $4,035,720 000 100.0% Non store sales, from prior page $0 $0 $4,035,720.000 $22.420,667 1 Store format's soles Must Edit Focal Merchandise Line 2. All apparel 100.0% Change ether I and/or 2 from 100% 1 Here, what are the sales of a particular format, 10 If percent of square feet are in one format, use th 2 Change 619 if given a percentage, otherwise, lea Do not estimate if this value is not provided $4,035,720.000 100.0% Number of stores 180 Match this number to the number of stores within Annual sales of line per store $22,420,667 First (February/March/April) per store $4,572,005 Second (May/June/Y) $5,360,294 Spring, per store $9,9350 This value must appear as "Previous years sales Third (August September/October) $5,576,150 Fourth (November/December/anuary] $6,912,217 Fal, per store $12,488,367 This value must appear as "Previous years sales in Quarter 23 Percent of season February STEP 1 11. Percent Previous $1443 5 1.705549 $ 1 7020 1.59.617 $1,654,160 $1,672,400 39,832,300 Bank Stock Method Calculations entory s STEP 4 14 15.0 15.0 170 180 50 $ Speg N oches D ent 13 Warta 14 C OM Retrade, inventory 15 BOM Stock 10 M COM KON O NI NA ONO OMOI ON $1.091127 10 Ca t enders 20 Cent Buy 19.000 179.000 2 000 2.000 00 . 0 0 0 0 1081127 Mandi Mp Percent V/0! Manned 23 Ante poss margin 24 Marko These values are from Tab 2 The "yellow cell show adjustments made to match green cells STEP 1: Paste monthly sales distribution for the appropriate type over the existing "bogus' values STEP 2: ADJUST THESE PERCENTS TO MATCH WITHIN 3 % OF EXPECTED, BUT TOTAL 100% STEP 3: ESTIMATE TOTAL SALES, use a 2-3 significant digit value within 10% of Previous Year Sales Method Calculations AVE.mo. Inventory sales STEP 4: Estimate Total Markdowns for the Season (2-3 significant digits) $0 $0 to the month STEP 5: Change these values to allocate the reductions by Try to be close to forecast NRF $ reductions Basic stock Step 6: Pasting in Census Averages for Inventory Make commitments for 3 months of this budget. Initial Markup Percents Maintained Estimated in tal markup
Step by Step Solution
There are 3 Steps involved in it

Get step-by-step solutions from verified subject matter experts