

Question: This is an excel and MatLAB question. Will give thumbs up for correct answers. Script output and code needed. The excel file clearly cant be
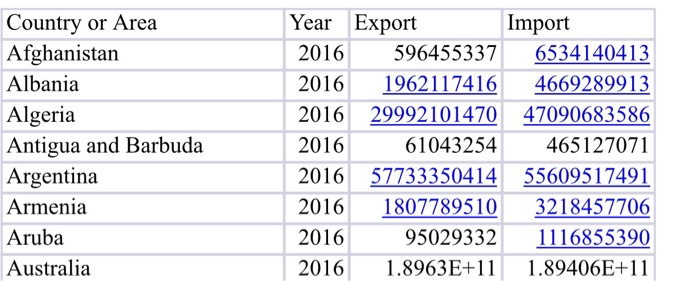
This is an excel and MatLAB question. Will give thumbs up for correct answers. Script output and code needed. The excel file clearly cant be uploaded so I took a picture of it. It is the excel sheet with the import and export data.
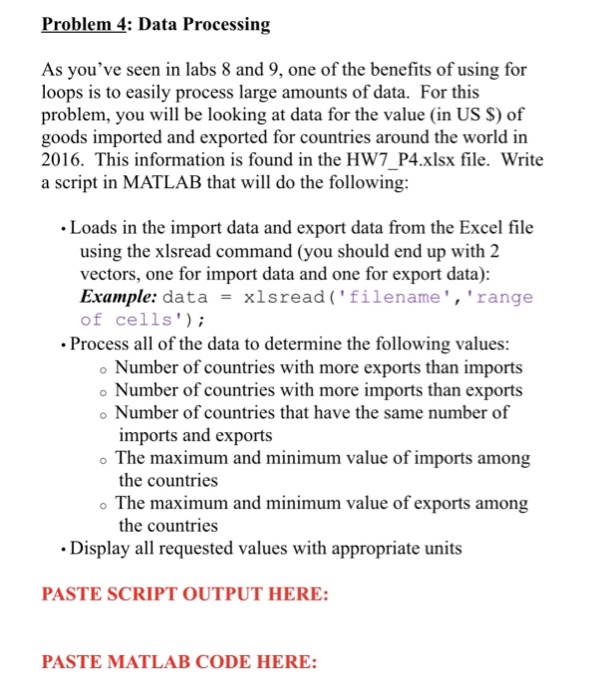
Problem 4: Data Processing As you've seen in labs 8 and 9, one of the benefits of using for loops is to easily process large amounts of data. For this problem, you will be looking at data for the value (in US S) of goods imported and exported for countries around the world in 2016. This information is found in the HW7 P4.xlsx file. Write a script in MATLAB that will do the following: Loads in the import data and export data from the Excel file using the xlsread command (you should end up with 2 vectors, one for import data and one for export data): Example: data = x1sread ( ' filename ' , ' range of cells Process all of the data to determine the following values: o Number of countries with more exports than imports o Number of countries that have the same number of o The maximum and minimum value of imports among Number of countries with more imports than exports imports and exports the countries The maximum and minimum value of exports among the countries Display all requested values with appropriate units PASTE SCRIPT OUTPUT HERE PASTE MATLAB CODE HERE
Step by Step Solution
There are 3 Steps involved in it

Get step-by-step solutions from verified subject matter experts