

Question: This is an exercise in predictive analytics. Estimation of the cost function and evaluation of the cost function is an important skill for MBAs. As
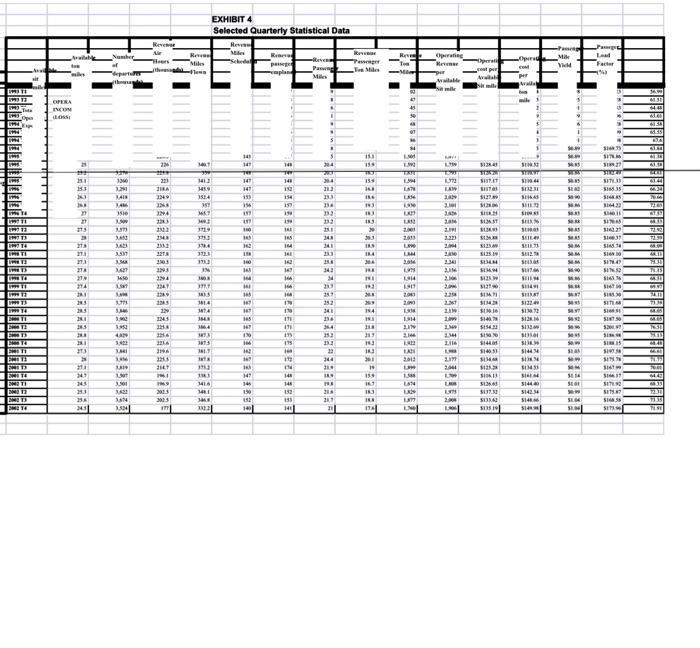
One of the most common mistakes using the High-Low method is picking the wrong data points. For the 're - analyzing' case, we'll be using the spreadsheet called Exhibit 2 and 4 side by side.
Let's find the data points to use for the Delta Low values. The case specifies that we will compare Revenue Passenger Miles and salary expense. Locate the appropriate columns on the spreadsheet: Revenue Passenger Miles in column AF and Salary and Related Costs in column G. Find the lowest value for Revenue Passenger Miles in column AF. It should be no surprise that it is the first time period, 93T1, with a value of 14. Now, for the SAME TIME PERIOD, locate the entry in column G. Your value for Salary and Related Costs in 93T1 is $1200. The Delta High values for your analysis are obtained in a similar method. Always use the same time period for both variables.
On another topic in the discussion boards, refresh your memory about operating leverage from the text, not from Investopedia and the like. In this class we are concerned about cost structure.
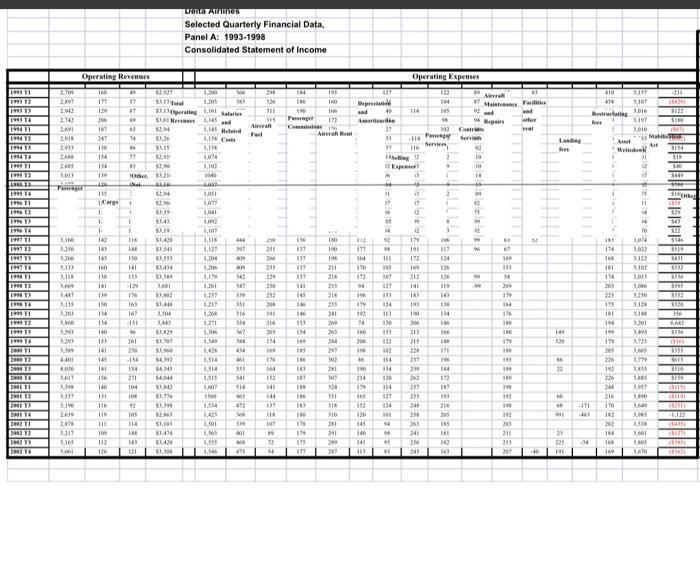
190311 1993 13 1913 FLO 1994 TI EL PHI 1994 TX 1994 1995 TI 1995 12 TERET THE TE 1996 1 1996 17 1996 T 1996 14 1997 11 1997 33 1997 13 1947 14 1998 11 1912 1993 1906 14 1999 11 1999 12 1999 13 1999 TE 2009 11 2000 12 2009 13 2000 14 MITI SHEYE 200113 2ME14 2002 11 2002 12 29923 2007 2,342 2,742 INT 2491 2018 2933 2008 2001 3,013 BALK JIM 1.250 3.240 2333 3.118 Xach 34KT 3.135 3.200 3300 3.390 3291 3.349 4,401 4010 LIVE Live 3.339 3,190 2436 2878 3317 3.16 LON Operating Revenues 108 441 129 206 INT 247 138 154 134 139 434 136 1 1 10 A Carg f 142 141 143 160 118 141 139 150 134 114 140 153 141 145 141 156 140 131 116 119 111 109 112 126 65 14 M 37 43 #V ST 67 53.15Operating 1,1 Salaries 53.00 Rev 1145 and $2,44 53.26 $3,45 $2,00 32.90 10 $3,2 Not F 151 LENTS 1,300 $1.11 Tal 1.005 16 261 230 -154 154 271 104 108 92 105 1 33,43 t $3,19 TIN $1,439 148 $3341 150 $5,353 141 $3,494 135 50,3 124 176 (6) 167 www. $2.94 31,96 $3.39 INFE $3,802 $1,448 3.504 1841 53.829 $3,397 $3,90 Delta Airlines Selected Quarterly Financial Data, Panel A: 1993-1998 Consolidated Statement of Income $4,392 $4,345 1404 33.342 53,77 53,3 $2,03 114 $1,193 146 $1,474 143 $3,428 121 $1,300 1,145 Related AM SIT WIT 1,074 1,102 1040 1051 LOTT 1,041 1092 3,107 1.116 1,127 1304 1,206 NIT 1,261 1,237 1,217 1,364 1,271 1306 1,349 LAN 1,314 1,514 1515 366 LOVE 1500 1534 1,425 1501 1561 1.555 1.546 *** 747 409 809 342 347 319 351 316 354 367 144 Ive 333 541 514 663 472 ww MY 100 Ma 475 16. 326 311 315 Aircraft Fod 259 251 244 231 229 250 252 204 HE 216 201 174 149 176 PH 201 HI 144 133 314 197 29 72 14 IN 16 100 Panger 136 117 137 137 137 141 145 146 146 553 154 149 185 116 DAT HE SAL 116 183 IM 876 179 175 177 wil 172 FIN 180 190 198 211 218 218 233 241 209 303 24 297 303 281 307 324 AME 318 310 241 291 249 287 Deprecat and Americ 112 177 IM 176 172 94 196 179 192 74 166 200 iss M 190 214 174 164 152 126 145 140 HI 127 DHE 46 27 33 37 M 31 17 in 25 Selling Expenses W 92 36 THE 10 107 827 133 134 113 130 201 114 134 126 114 127 134 Operating Expenses HE 76 114 94 95 AS blemy - He Servie d fr d 17 400 M 333 213 822 215 123 174 191 178 tes 212 141 183 193 190 206 228 237 239 EVE 132 104 bas 257 233 241 258 263 241 254 241 102 Contr 196 117 124 126 126 119 14) 138 134 146 M 145 171 196 144 172 147 WA 143 216 205 145 THE 182 163 52 and Servin 013 10 14 3 16 3 33 Maintenance Facilities 199 Repairs 19 67 169 153 58 269 179 144 176 TAK ONE 179 148 195 ME 109 198 192 198 192 201 211 213 201 real 26 40 Landing **** M 21E IN IM it 225 16 410 309 458 3,307 Restrarloating 3.016 3,197 2010 1-34 fee IKE 174 391 THE 174 201 175 INE IN MI (79 205 226 192 226 240 216 471 170 182 202 184 164 109 Ausel 31 12 47 entres. # 15 11 44 M 10 3474 1.002 3.322 3302 1003 1.006 3210 3,428 1,14 3.201 3,493 3.723 3,005 3,779 3815 3.305 3,957 3,390 3.609 3,985 3,538 1801 211 (342) $122 3,305 1670 (ly 3154 SIN $40 3400 T-p015 1558 529 545 534 3519 5431 3332 3336 $595 8552 13.30 356 KARZ 5336 DIRE 3355 3613 5510 3154 1600) din (5251) 44,122 (505) ALCIN chikh AND
Step by Step Solution
3.53 Rating (156 Votes )
There are 3 Steps involved in it
The HighLow Method The HighLow method is a technique used to split a cost into its fixed and variable components It involves taking the highest and lo... View full answer

Get step-by-step solutions from verified subject matter experts