

Question: This is based on a full-scale, real-world problem, where the Food and Agriculture Organization of the (FAO) commissioned the Institute of Business Research here at
This is based on a full-scale, real-world problem, where the Food and Agriculture Organization of the (FAO) commissioned the Institute of Business Research here at WMS to redesign the poverty line food basket in the Solomon Islands, in order to minimize costs while meeting constraints on 17 types of nutrients. Note that some of these constraints are minimums (e.g. the diet has to have at least 30grams of fiber per day), some are maximums (e.g. the diet cannot have more than 94 grams of fat per day) and one of them is an equality constraint (the diet must provide 2815 calories per day -to make the resulting diet comparable to the existing basket of foods used in the food poverty line that also provides 2815 calories). Note that the existing basket was set based on observing actual demand patterns of poor households and this "cost of basic needs" basket would cost SBD$6429 per person per year for a diet that supplied 2815 calories per day (in NZD terms this is about $1200, so just over $3 per day).
Your objective is to use the Simplex method of Linear Programming to redesign the food basket in a cost-minimizing way, and to interpret the shadow cost of various nutrients in the optimal solution. If you wanted to read more about this use of LP for setting food poverty lines, but in a different setting, there is a discussion in this working paper:
Instructions:
The Excel file Diet.xlsx has a tab "Nutrient contents" that has data on the existing Cost-of-Basic-Needsfood poverty line basket for the Solomon Islands. The 50 foods in this basket provide 2815 calories per day, from annual spending of SBD$6429. The decision variables are in cells B3-B52, and these are annual quantities of each food in the basket, where the initial quantities are based on the actual diet pattern of poor households in the Solomon Islands.
Using the "sum-product" command, the daily calories have been calculated for you. Note that the nutrient content is per 100grams, so the result of the sum-product command is divided by 36.5 (for 365 days in a year, but the nutrient contents are only in terms of 0.1 kg rather than per 1 kg, so give the nutrients provided by the diet for just one-tenth of a year, and dividing that by 36.5 gives a daily value). You need to use the sum-product command to also calculate the daily consumption of each of the other nutrients (e.g. fiber, zinc) from the given diet.
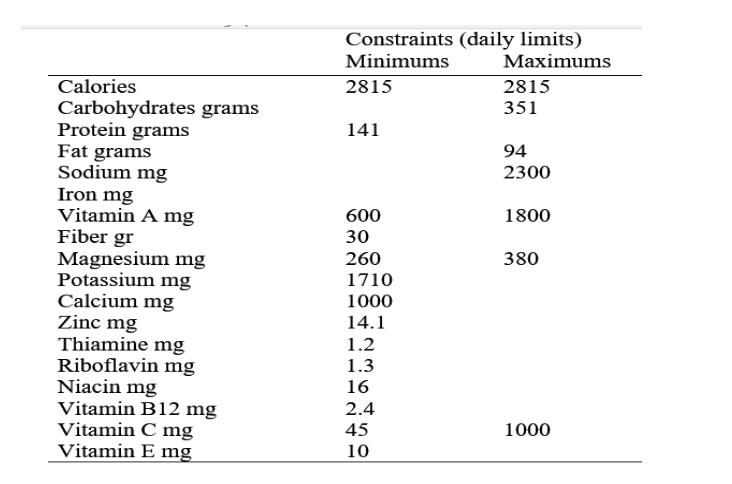
Next, you need to enter the constraints. Some are maximums and some are minimums. The easiest way to do this is to add two rows, with constraints, under the existing data. The constraints are as follows:
The objective function is in cell D54. You should instruct Solver that you want to minimize this objective function (subject to meeting the multiple constraints, where some are less than or equal to, some are greater than or equal to, and one is equality). Note that you will have to enter constraints into the appropriate cells in your worksheet, and you will use the "Add" button in the Solver dialog box to add each constraint (note that there are more constraints than there are nutrients because some are subject to both a minimum and a maximum). Calculate the cost-minimizing diet, and when you use silver, request an "Answer report" and a "Sensitivity report". Attach these reports to the Word file and use their contents to help answer the questions below.
(a) How many foods are in the cost-minimized diet and what is the annual cost of the diet?
(b) How many of the nutritional constraints are binding?
(c) From the Sensitivity Report, obtain the shadow price of Calories, and of carbohydrates. Report these and interpret them.
Calories Carbohydrates grams Protein grams Fat grams Sodium mg Iron mg Vitamin A mg Fiber gr Magnesium mg Potassium mg Calcium mg Zinc mg Thiamine mg Riboflavin mg Niacin mg Vitamin B12 mg Vitamin C mg Vitamin E mg Constraints (daily limits) Minimums 2815 141 600 30 260 1710 1000 14.1 1.2 1.3 16 2.4 45 10 Maximums 2815 351 94 2300 1800 380 1000
Step by Step Solution
3.43 Rating (162 Votes )
There are 3 Steps involved in it
Answer a A new report found that keeping the MyPlate Dietary Guidelines would cost a group of four b... View full answer

Get step-by-step solutions from verified subject matter experts