

Question: This is done in matlab. Also what would I do if I had the file for the cat picture and saved it to matlab, to
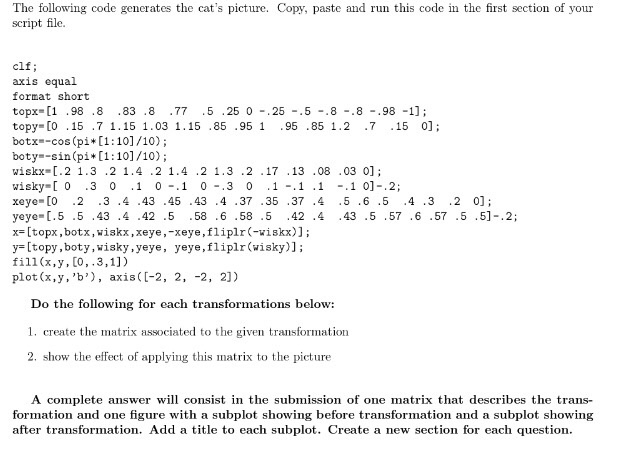
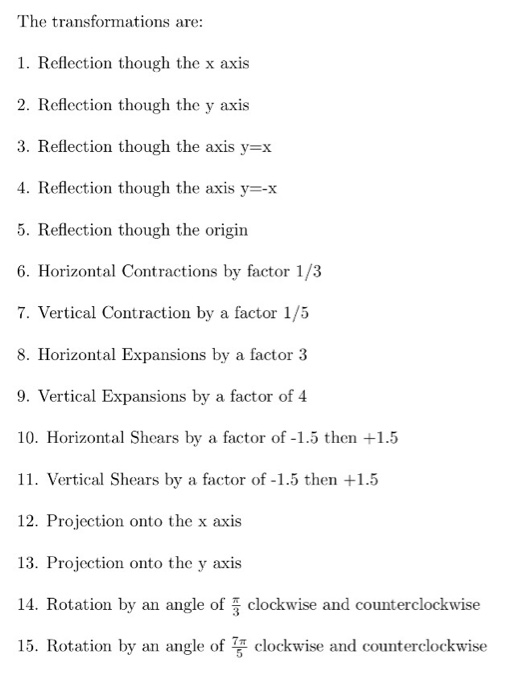
The following code generates the cat's picture. Copy, paste and run this code in the first section of your script file clf; axis equal format short topx-[1 .98 .8 83 .8 .77 5 .25 0 .25 -.5 -.8 -.8 -.98 -1] topy_[O .15 .7 1.15 1.03 1.15 .85 .95 1 .95 .85 1.2 .7 .15 0]; botx-cos (pi [1 10]/10); boty--sin (pi* [1:101/10); wiskx [.2 1.3 .2 1.4 .2 1.4 .2 1.3 .2 .17 .13 .08 .03 0]; wisky-I 0 .3 0 1 0 1 0 .3 0 1.1 .1 .1 01-.2; xeye-[0 2 3 .4 .43 .45 .43 .4 37 .35 .37 .4 .5.6 .5 .4.3 2 0; yeye-[.5.5 .43 .4 .42 .5 .58 .6 .58 .5 42 .4 43 .5 .57.6.57 .5 .5]-.2; x= [topx, botx, wiskx , xeye,"Xeye, flip!r (-wiskx)); [topy , boty,wisky , yeye, yeye , fliplr(wisky)]; plot(x,y, 'b), axis([-2, 2, -2, 2]) Do the following for each transformations below: 1. create the matrix associated to the given transformation 2. show the effect of applying this matrix to the picture A complete answer will consist in the submission of one matrix that describes the trans- formation and one figure with a subplot showing before transformation and a subplot showing after transformation. Add a title to each subplot. Create a new section for each
Step by Step Solution
There are 3 Steps involved in it

Get step-by-step solutions from verified subject matter experts