

Question: This is everything given Show step by step It is proposed to improve a 12-mile stret mprovement invonvrove a 12-mile stretch of an existing 4
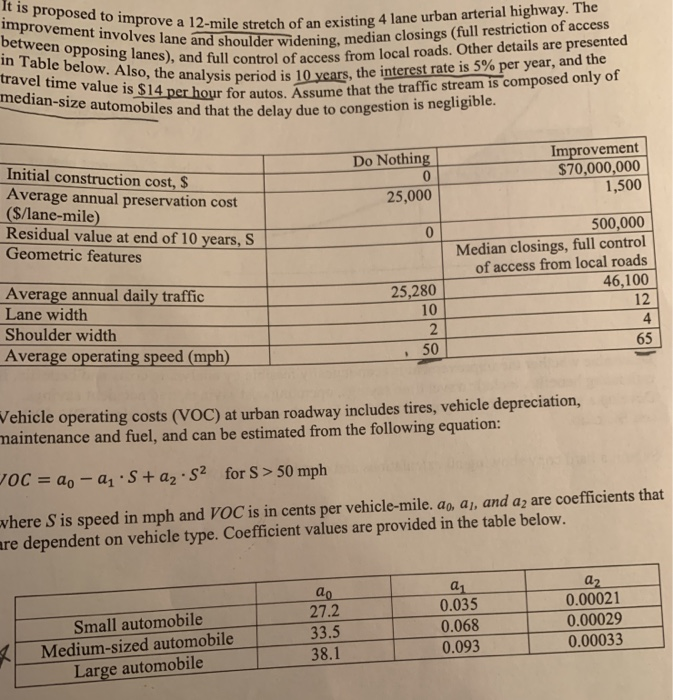
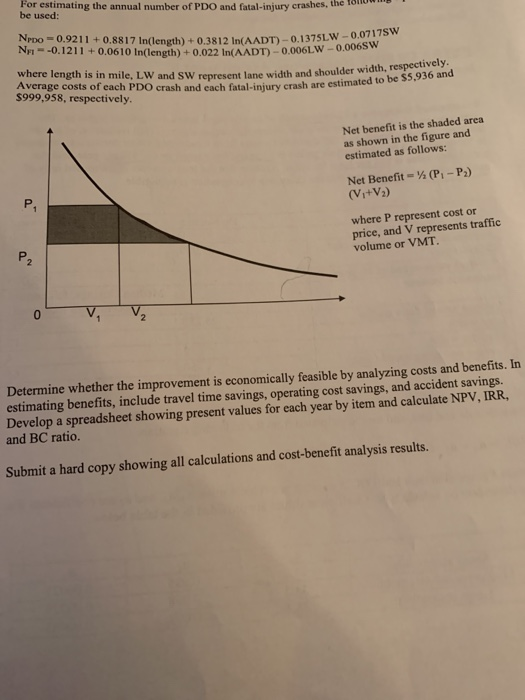
It is proposed to improve a 12-mile stret mprovement invonvrove a 12-mile stretch of an existing 4 lane urban arterial highway. The in Table below. Also, the period travel time value is $14 per hour Assume ssanes), and full control of access from local roads. Other details are presented r for autos. Assume that the traffic stream is composed only of ane and shoulder widening, median closings (full restriction of access analysis period is l 0years, the intere trteis 5% per year, and the median-size automobiles and that the delay due to cong estion is negligible. Do Nothin Improvement Initial construction cost, S Average annual preservation cost (S/lane-mile) Residual value at end of 10 years, S Geometric features $70,000,000 1,500 25,000 500,000 Average annual daily traffic Lane width Shoulder width Median closings, full control of access from local roads 46,100 12 4 65 25,280 10 Average operating speed (mph) 50 Vehicle operating costs (VOC) at urban roadway includes tires, vehicle depreciation, maintenance and fuel, and can be estimated from the following equation: OC = ao-a! . S + a2" S2 for S > 50 mph where S is speed in mph and VOC is in cents per vehicle-mile. ao, al, and a2 are coefficients that re dependent on vehicle type. Coefficient values are provided in the table below. Small automobile Medium-sized automobile Large automobile 27.2 33.5 38.1 0.035 0.068 0.093 0.00021 0.00029 0.00033 For estimating the annual number of PDO and fatal-injury crashes, the iom be used: NrDo 0.9211 + 0.8817 In(dength)+0.3812 In(AADT)-013751W-0 Nn--0.1 2 1 1 + 0.06 10 Indlength) + 0.0221n(AADT)-0-006LW-0.000s w LW-0.0717Sw where length is in mile, LW and sW represent lane width and shoulder widt Average costs of each PDO crash and each fatal-injury crash are estimat $999,958, respectively ed to be $5,936 and Net benefit is the shaded area as shown in the figure and estimated as follows: Net Benefit-(P1-P2) (Vi+V2) P. where P represent cost or price, and V represents traffic volume or VMT 0 Determine whether the improvement is economically feasible by analyzing costs and benefits. In estimating benefits, include travel time savings, operating cost savings, and accident savings. Develop a spreadsheet showing present values for each year by item and calculate NPV, IRR, and BC ratio. Submit a hard copy showing all calculations and cost-benefit analysis results. It is proposed to improve a 12-mile stret mprovement invonvrove a 12-mile stretch of an existing 4 lane urban arterial highway. The in Table below. Also, the period travel time value is $14 per hour Assume ssanes), and full control of access from local roads. Other details are presented r for autos. Assume that the traffic stream is composed only of ane and shoulder widening, median closings (full restriction of access analysis period is l 0years, the intere trteis 5% per year, and the median-size automobiles and that the delay due to cong estion is negligible. Do Nothin Improvement Initial construction cost, S Average annual preservation cost (S/lane-mile) Residual value at end of 10 years, S Geometric features $70,000,000 1,500 25,000 500,000 Average annual daily traffic Lane width Shoulder width Median closings, full control of access from local roads 46,100 12 4 65 25,280 10 Average operating speed (mph) 50 Vehicle operating costs (VOC) at urban roadway includes tires, vehicle depreciation, maintenance and fuel, and can be estimated from the following equation: OC = ao-a! . S + a2" S2 for S > 50 mph where S is speed in mph and VOC is in cents per vehicle-mile. ao, al, and a2 are coefficients that re dependent on vehicle type. Coefficient values are provided in the table below. Small automobile Medium-sized automobile Large automobile 27.2 33.5 38.1 0.035 0.068 0.093 0.00021 0.00029 0.00033 For estimating the annual number of PDO and fatal-injury crashes, the iom be used: NrDo 0.9211 + 0.8817 In(dength)+0.3812 In(AADT)-013751W-0 Nn--0.1 2 1 1 + 0.06 10 Indlength) + 0.0221n(AADT)-0-006LW-0.000s w LW-0.0717Sw where length is in mile, LW and sW represent lane width and shoulder widt Average costs of each PDO crash and each fatal-injury crash are estimat $999,958, respectively ed to be $5,936 and Net benefit is the shaded area as shown in the figure and estimated as follows: Net Benefit-(P1-P2) (Vi+V2) P. where P represent cost or price, and V represents traffic volume or VMT 0 Determine whether the improvement is economically feasible by analyzing costs and benefits. In estimating benefits, include travel time savings, operating cost savings, and accident savings. Develop a spreadsheet showing present values for each year by item and calculate NPV, IRR, and BC ratio. Submit a hard copy showing all calculations and cost-benefit analysis results
Step by Step Solution
There are 3 Steps involved in it

Get step-by-step solutions from verified subject matter experts