

Question: this is for a strategic budget and analysis class at palm beach atlantic. OMPARING COMPANIES See the information provided for Company A and Company B
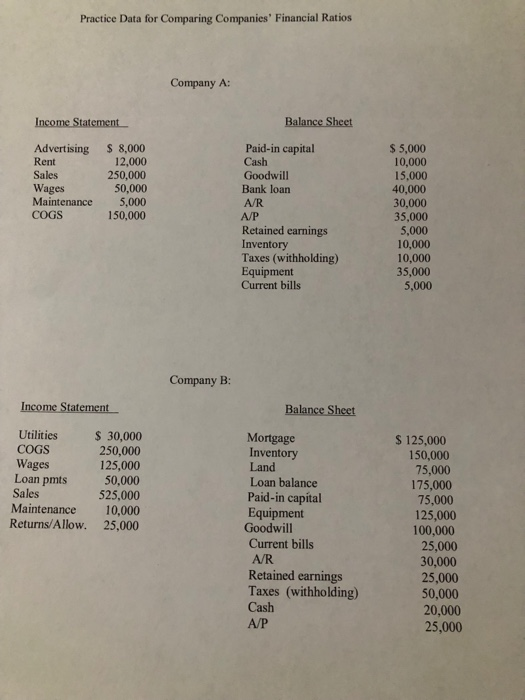
OMPARING COMPANIES See the information provided for Company A and Company B in Data r Comparing Companies found HERE, which will be the basis of our initial iscussion question. . From the data indicated under the respective columns, create an Income Statement and Balance Sheet for Company A and an Income Statement and Balance Sheet for Company B. Note: Recall that the total assets and total equities (total liabilities + owner's equity (or net worth) must be equal in the Balance Sheet. 3. From the repective financial statements, calculate the various profitability, liquidity, and solvency ratios that we practiced last week. Note: if you would like to do so, calculate the "efficiency ratios", i.e. the Inventory Turnover rate and the Average Collection Period. 4. Then, compare the ratios between the two firms and indicate which company you believe is financially healthier, and explain why. 5. Submit your ratio calculations and indication of which company is financially healthier than the other (and why). Practice Data for Comparing Companies' Financial Ratios Company A: Balance Sheet Advertising 8,000 Rent Sales Wages Maintenance 5,000 COGS Paid-in capital Cash Goodwill Bank loan A/R A/P Retained earnings Inventory Taxes (withholding) Equipment Current bills $ 5,000 10,000 15,000 40,000 30,000 35,000 5,000 10,000 10,000 35,000 5,000 12,000 250,000 50,000 150,000 Company B Balance Sheet Utilities 30,000 250,000 125,000 Loan pmts 50,000 525,000 Maintenance 10,000 Returns/Allow. 25,000 Mortgage Inventory Land Loan balance Paid-in capital Equipment Goodwill Current bills A/R Retained earnings Taxes (withholding) Cash A/P COGS Wages S 125,000 150,000 75,000 175,000 Sales 75,000 125,000 100,000 25,000 30,000 25,000 50,000 20,000 25,000
Step by Step Solution
There are 3 Steps involved in it

Get step-by-step solutions from verified subject matter experts