

Question: This is for econ 201 Exhibit 3 - Exhibit 3 x o 0 x (2) (3) (4) Refer to Exhibit 3. Which PPF graph best

This is for econ 201
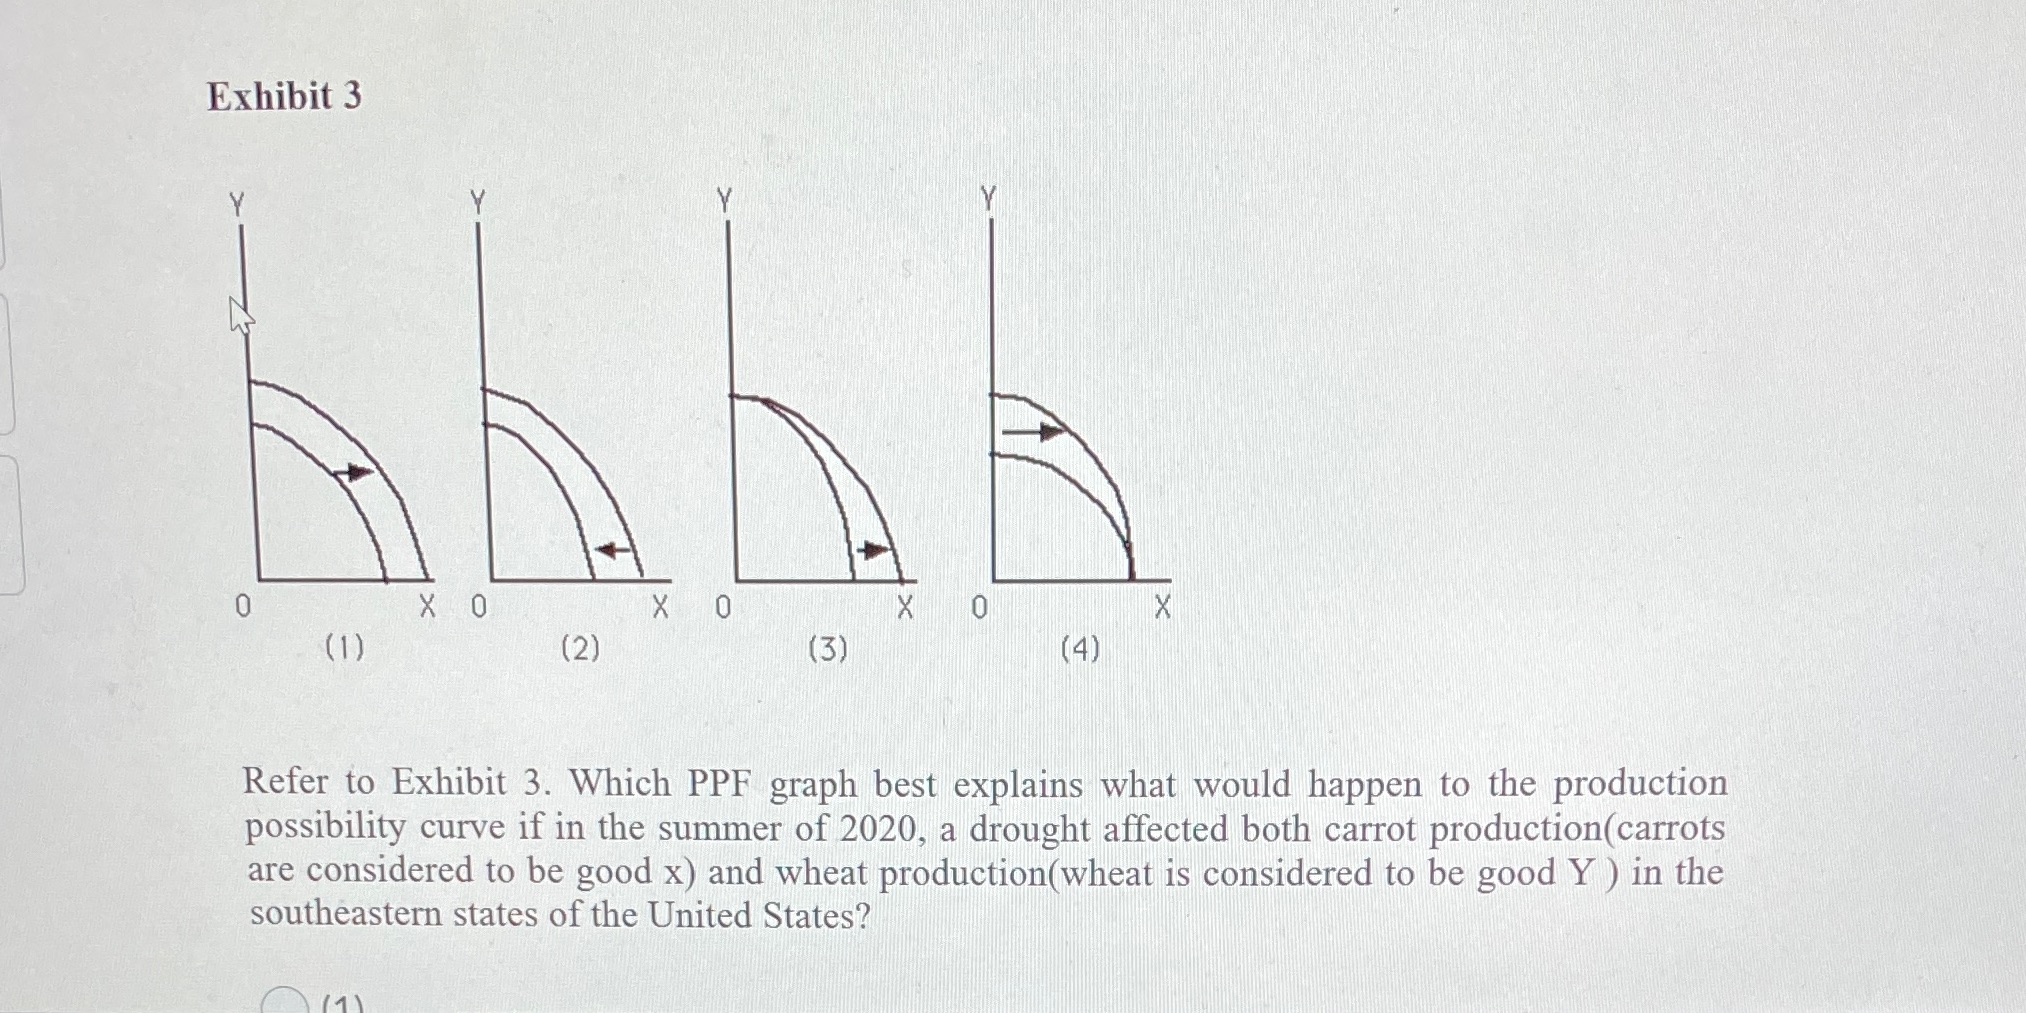
Exhibit 3 -
Exhibit 3 x o 0 x (2) (3) (4) Refer to Exhibit 3. Which PPF graph best explains what would happen to the production possibility curve if in the summer of 2020, a drought affected both carrot production(carrots are considered to be good x) and wheat production(wheat is considered to be good Y ) in the southeastern states of the United States?
Step by Step Solution
There are 3 Steps involved in it
1 Expert Approved Answer
Step: 1 Unlock

Question Has Been Solved by an Expert!
Get step-by-step solutions from verified subject matter experts
Step: 2 Unlock
Step: 3 Unlock