

Question: This is for my Biological Complexity class and you need to use R Studio for the problems [2.1 I Level 1] How many nodes, links,
![use R Studio for the problems [2.1 I Level 1] How many](https://dsd5zvtm8ll6.cloudfront.net/si.experts.images/questions/2024/09/66f13f0ea3226_35066f13f0e42e58.jpg)
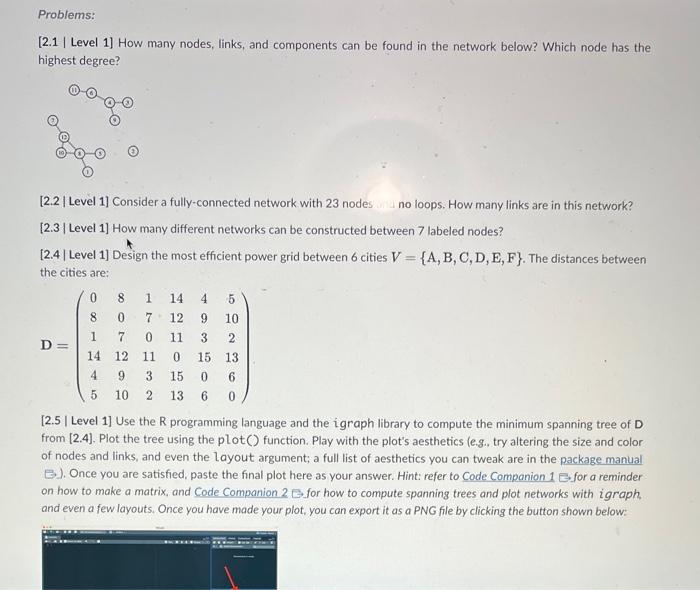
[2.1 I Level 1] How many nodes, links, and components can be found in the network below? Which node has the highest degree? [2.2 | Level 1] Consider a fully-connected network with 23 nodes in no loops. How many links are in this network? [2.3 | Level 1] How many different networks can be constructed between 7 labeled nodes? [2.4 | Level 1] Design the most efficient power grid between 6 cities V={A,B,C,D,E,F}. The distances between the cities are: D=081144580712910170113214121101513493150651021360 [2.5 | Level 1] Use the R programming language and the igraph library to compute the minimum spanning tree of D from [2.4]. Plot the tree using the plot () function. Play with the plot's aesthetics (e.g., try altering the size and color of nodes and links, and even the layout argument; a full list of aesthetics you can tweak are in the package manual B). Once you are satisfied, paste the final plot here as your answer. Hint: refer to Code Companion 1 . for a reminder on how to make a matrix, and Code Companion 2 Gor how to compute spanning trees and plot networks with igraph, and even a few layouts, Once you have made your plot, you can export it as a PNG file by clicking the button shown below: [2.5 | Level 1] Use the R programming language and the igraph library to compute the minimum spanning tree of D from [2.4]. Plot the tree using the plot() function. Play with the plot's aesthetics (e.g., try altering the size and color of nodes and links, and even the layout argument; a full list of aesthetics you can tweak are in the package manual B). Once you are satisfied, paste the final plot here as your answer. Hint: refer to Code Companion 1 E for a reminder on how to make a matrix, and Code Companion 2 . for how to compute spanning trees and plot networks with igraph. and even a few layouts. Once you have made your plot, you can export it as a PNG file by clicking the button shown below: [2.6 | Level 1] Find the fastest route from node 1 to node 5 in a network described by the following distance matrix. Please show how you arrived at the answer. D=0368930167610318630197110 [2.7 | Level 1] In a directed network described by the adjacency matrix below, what are the in-and out-degree of the three nodes? A=010100212 [2.8 | Level 1] Calculate the diameter of every component with more than one node for the network in [2.1]. Use both definitions of diameter that you have learned in Lecture 7 (i.e., four answers total)
Step by Step Solution
There are 3 Steps involved in it

Get step-by-step solutions from verified subject matter experts