

Question: this is for problem 2 Problem 1: (50 points). Use the table and figure below to answer questions about the ARGOT project a. Compute the
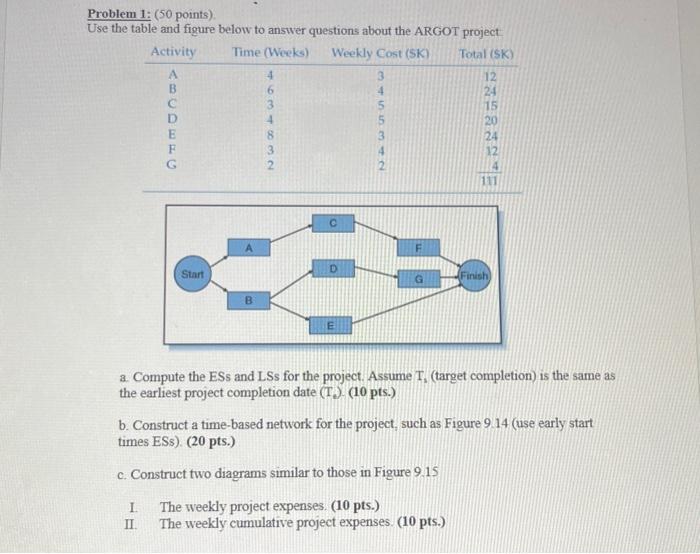
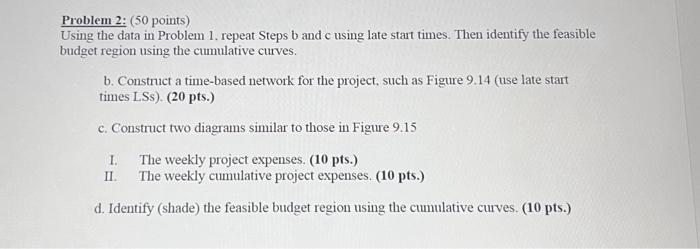
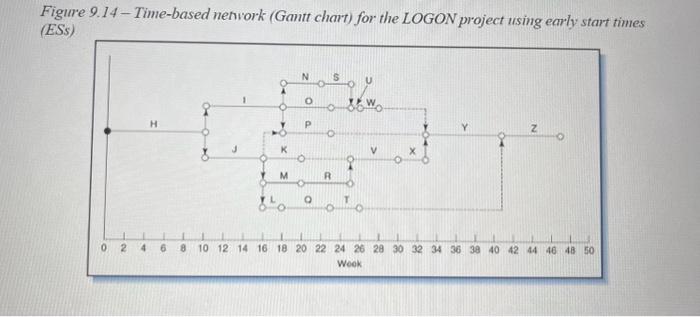
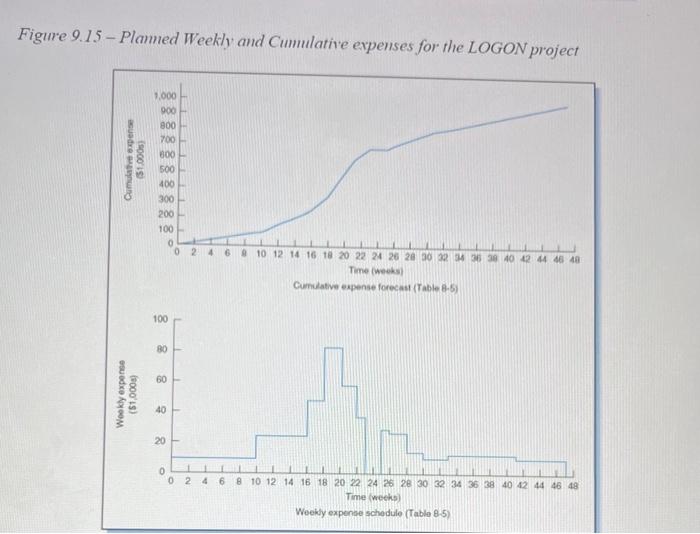
Problem 1: (50 points). Use the table and figure below to answer questions about the ARGOT project a. Compute the ESs and LSs for the project. Assume T2 (target completion) is the same as the earliest project completion date (T) (10pts.) b. Construct a time-based network for the project, such as Figure 9.14 (use early start times ESs). (20 pts.) c. Construct two diagrams similar to those in Figure 9.15 I. The weekly project expenses. (10 pts.) II. The weekly cumulative project expenses. (10 pts.) Problem 2: (50 points) Using the data in Problem 1. repeat Steps b and c using late start times. Then identify the feasible budget region using the cumulative curves. b. Construct a time-based network for the project, such as Figure 9.14 (use late start times LSs). (20 pts.) c. Construct two diagrams similar to those in Figure 9.15 I. The weekly project expenses. (10 pts.) II. The weekly cumulative project expenses. (10 pts.) d. Identify (shade) the feasible budget region using the cumulative curves. (10 pts.) Figure 9.14 - Time-based network (Gantt chart) for the LOGON project using early start times (ESs) Figure 9.15 - Plamed Weekly and Cumulative expenses for the LOGON project
Step by Step Solution
There are 3 Steps involved in it

Get step-by-step solutions from verified subject matter experts