

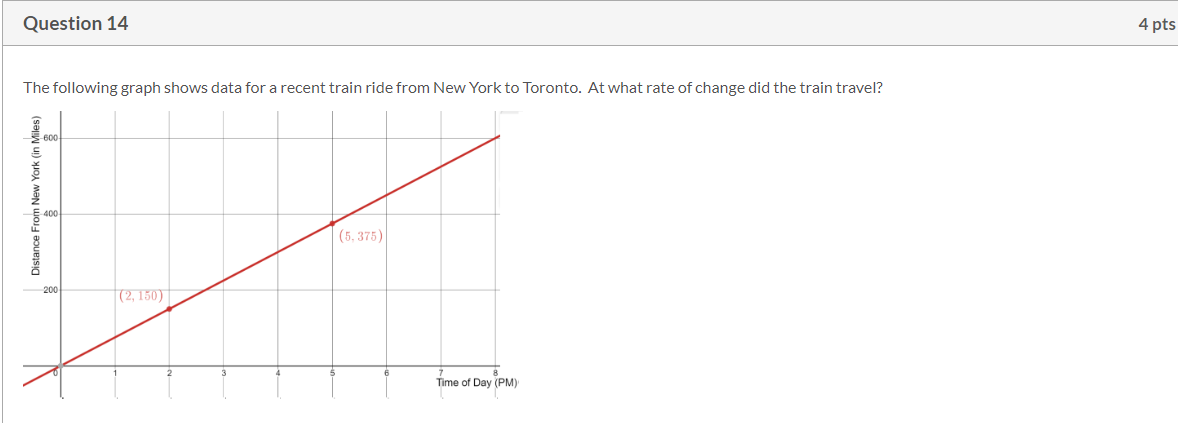
Question: This is it Question 14 4 pts The following graph shows data for a recent train ride from New York to Toronto. At what rate
This is it
Step by Step Solution
There are 3 Steps involved in it
1 Expert Approved Answer
Step: 1 Unlock

Question Has Been Solved by an Expert!
Get step-by-step solutions from verified subject matter experts
Step: 2 Unlock
Step: 3 Unlock