

Question: This is just the problem I was given. If you can reach a solution without using cubic splines, that is totally okay. I really just
This is just the problem I was given. If you can reach a solution without using cubic splines, that is totally okay. I really just need help reaching a solution.
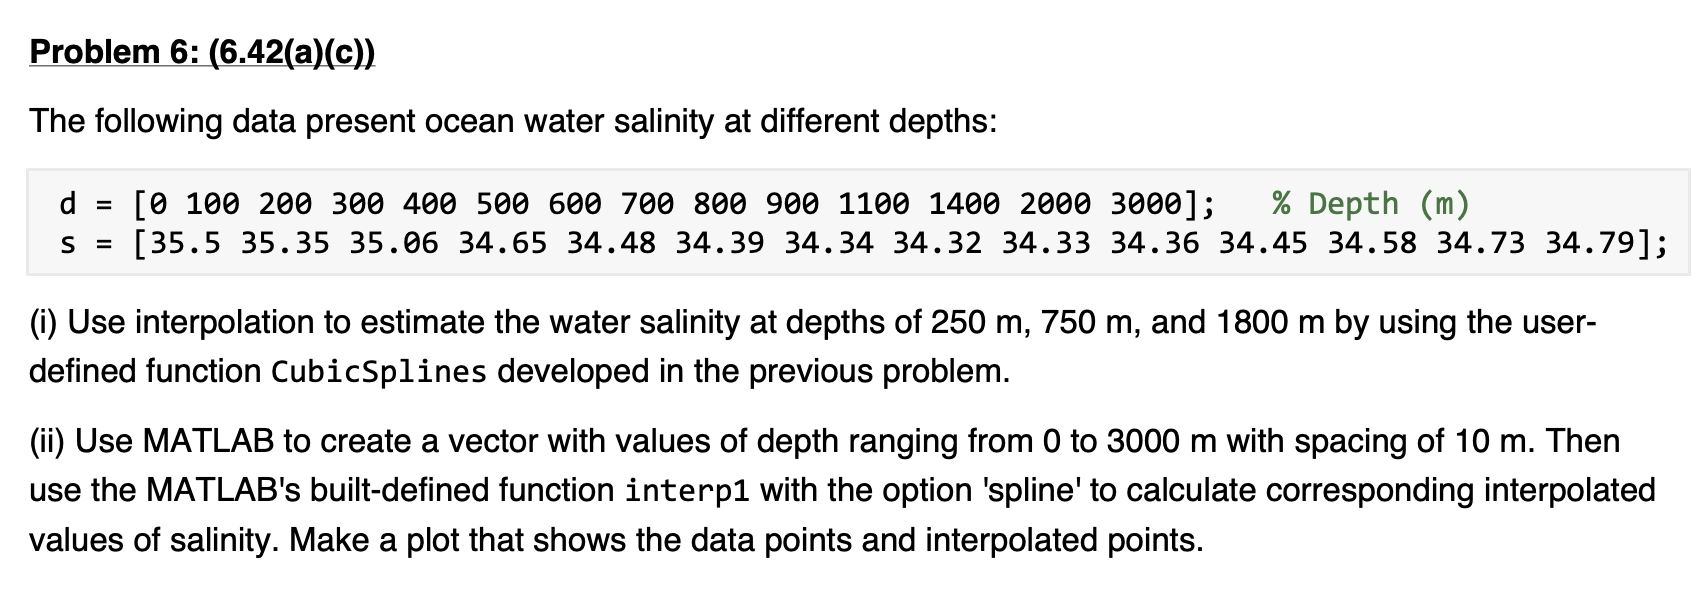
Problem 6: (6.42(a)(c)) The following data present ocean water salinity at different depths: d = [0 100 200 300 400 500 600 700 800 900 1100 1400 2000 3000]; % Depth (m) [35.5 35.35 35.06 34.65 34.48 34.39 34.34 34.32 34.33 34.36 34.45 34.58 34.73 34.79]; S = (i) Use interpolation to estimate the water salinity at depths of 250 m, 750 m, and 1800 m by using the user- defined function CubicSplines developed in the previous problem. (ii) Use MATLAB to create a vector with values of depth ranging from 0 to 3000 m with spacing of 10 m. Then use the MATLAB's built-defined function interp1 with the option 'spline' to calculate corresponding interpolated values of salinity. Make a plot that shows the data points and interpolated points
Step by Step Solution
There are 3 Steps involved in it

Get step-by-step solutions from verified subject matter experts