

Question: this is matlab code, please help ?heres the link to the data years vs horsepower CARDDATA 0.0 1.0 2.0 3.0 4.0 5.0 6.0 7.0 8.0
this is matlab code, please help
?heres the link to the data
years vs horsepower
| 0.0 1.0 2.0 3.0 4.0 5.0 6.0 7.0 8.0 9.0 10.0 11.0 12.0 13.0 14.0 15.0 16.0 17.0 18.0 19.0 20.0 21.0 22.0 23.0 24.0 25.0 26.0 27.0 28.0 | 142.51 144.17 152.62 156.63 165.38 168.57 178.6 188.28 190.12 198.32 203.83 203.53 208.94 216.71 224.38 232.16 247.82 258.88 260.86 262.72 263.65 274.86 272.42 267.99 277.1 284.92 286.27 288.45 281.36 |
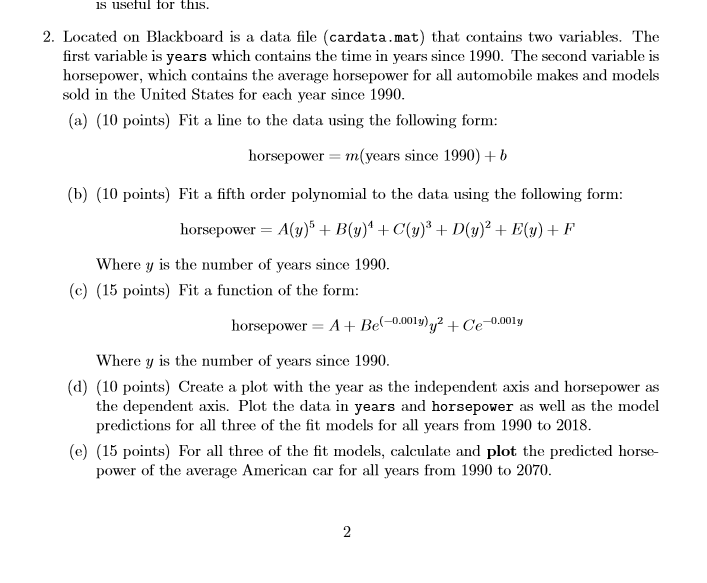
s useful for this. 2. Located on Blackboard is a data file (cardata.mat) that contains two variables. The first variable is years which contains the time in years since 1990. The second variable is horsepower, which contains the average horsepower for all automobile makes and models sold in the United States for each year since 1990 (a) (10 points) Fit a line to the data using the following form horsepower- m(years since 1990) +b (b) (10 points) Fit a fifth order polynomial to the data using the following form horsepower A(y)B()C()D(y)2 E() Where y is the number of years since 1990 (c) (15 points) Fit a function of the form: 0.001y horsepower A + Be(-0.0019)? + Ce Where y is the number of years since 1990 (d) (10 points) Create a plot with the year as the independent axis and horsepower as the dependent axis. Plot the data in years and horsepower as well as the model predictions for all three of the fit models for all years from 1 1990 to 2018 (e) (15 points) For all three of the fit models, calculate and plot the predicted horse- power of the average American car for all years from 1990 to 2070 s useful for this. 2. Located on Blackboard is a data file (cardata.mat) that contains two variables. The first variable is years which contains the time in years since 1990. The second variable is horsepower, which contains the average horsepower for all automobile makes and models sold in the United States for each year since 1990 (a) (10 points) Fit a line to the data using the following form horsepower- m(years since 1990) +b (b) (10 points) Fit a fifth order polynomial to the data using the following form horsepower A(y)B()C()D(y)2 E() Where y is the number of years since 1990 (c) (15 points) Fit a function of the form: 0.001y horsepower A + Be(-0.0019)? + Ce Where y is the number of years since 1990 (d) (10 points) Create a plot with the year as the independent axis and horsepower as the dependent axis. Plot the data in years and horsepower as well as the model predictions for all three of the fit models for all years from 1 1990 to 2018 (e) (15 points) For all three of the fit models, calculate and plot the predicted horse- power of the average American car for all years from 1990 to 2070
Step by Step Solution
There are 3 Steps involved in it

Get step-by-step solutions from verified subject matter experts