

Question: this is matlab question. Question: The main program and the code: other basic data is from here You can google SOCR Data MLB HeightsWeights to
this is matlab question.
Question: 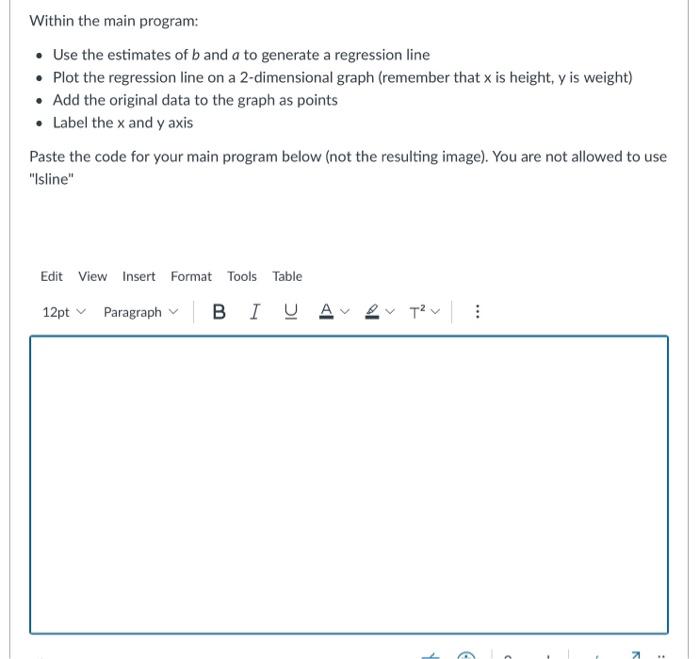
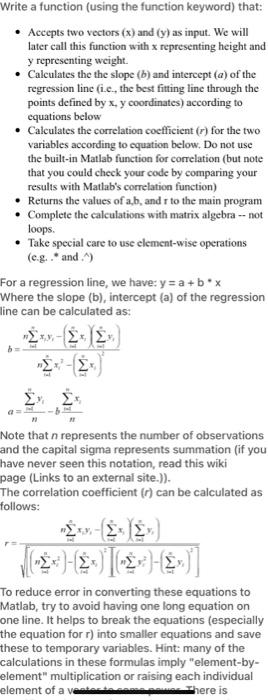
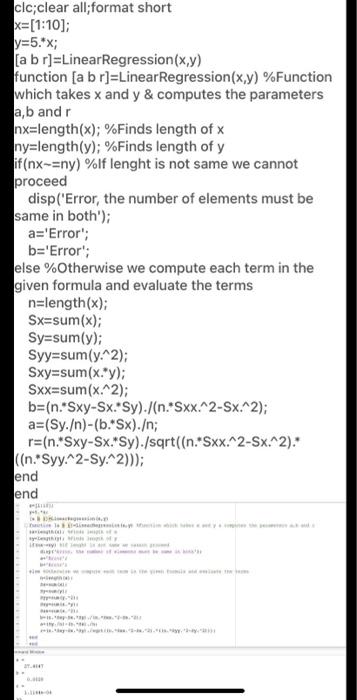
The main program and the code:
other basic data is from here
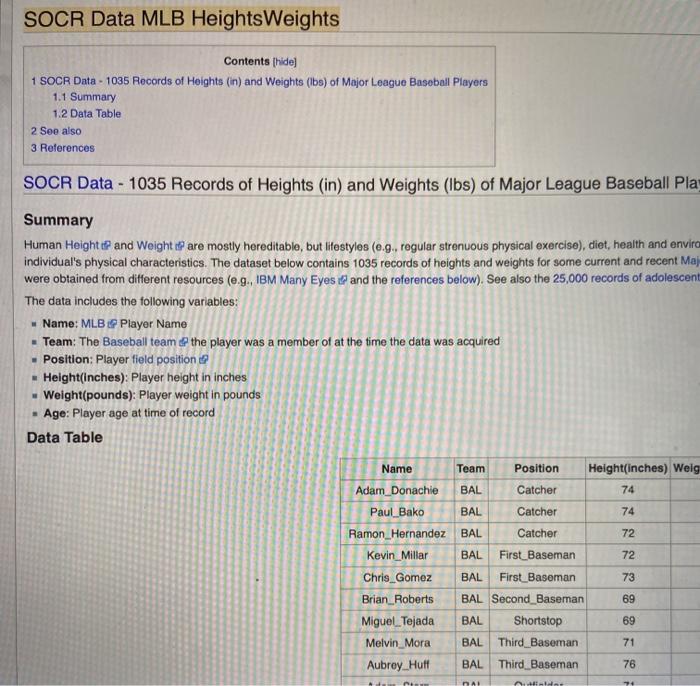
You can google SOCR Data MLB HeightsWeights to find it
Within the main program: Use the estimates of b and a to generate a regression line Plot the regression line on a 2-dimensional graph (remember that x is height, y is weight) Add the original data to the graph as points Label the x and y axis Paste the code for your main program below (not the resulting image). You are not allowed to use "Isline" Edit View Insert Format Tools Table 12ptParagraph
Step by Step Solution
There are 3 Steps involved in it
1 Expert Approved Answer
Step: 1 Unlock

Question Has Been Solved by an Expert!
Get step-by-step solutions from verified subject matter experts
Step: 2 Unlock
Step: 3 Unlock