

Question: This is my first time taking a Statistics class and I was hoping you might be able to help/provide guidance with the questions they are
This is my first time taking a Statistics class and I was hoping you might be able to help/provide guidance with the questions they are asking? I was able to get through steps 1-5 this is the 6th step.
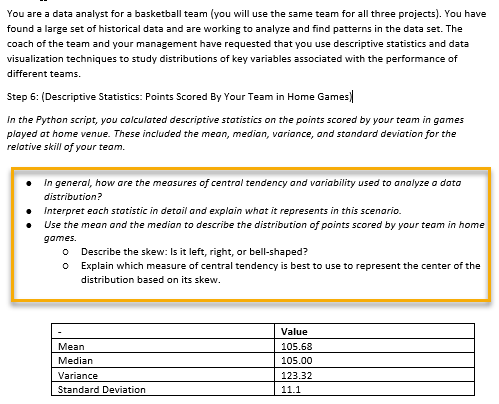
You are a data analyst for a basketball team (you will use the same team for all three projects). You have found a large set of historical data and are working to analyze and find patterns in the data set. The coach of the team and your management have requested that you use descriptive statistics and data visualization techniques to study distributions of key variables associated with the performance of different teams. Step 6: (Descriptive Statistics: Points Scored By Your Team in Home Games)| In the Python script, you calculated descriptive statistics on the points scored by your team in games played at home venue. These included the mean, median, variance, and standard deviation for the relative skill of your team. In general, how are the measures of central tendency and variability used to analyze a date distribution? Interpret each statistic in detail and explain what it represents in this scenario. Use the mean and the median to describe the distribution of points scored by your team in home gomes. 0 Describe the skew: Is it left, right, or bell-shaped? 0 Explain which measure of central tendency is best to use to represent the center of the distribution based on its skew. Value Mean 105.68 Median 105.00 Variance 123.32 Standard Deviation 1
Step by Step Solution
There are 3 Steps involved in it

Get step-by-step solutions from verified subject matter experts