

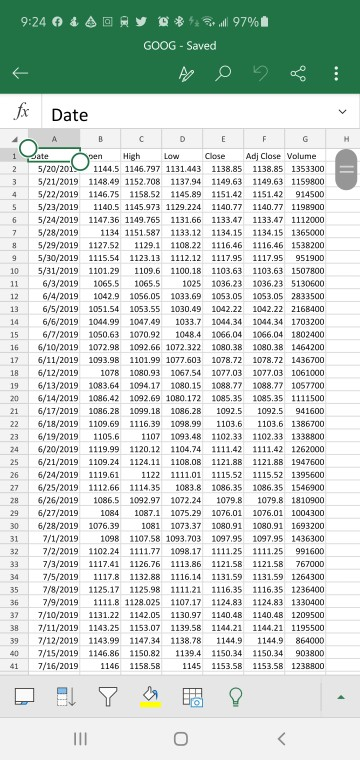
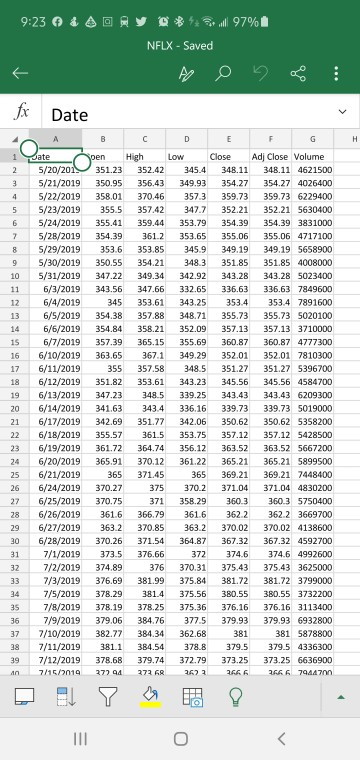
Question: this is one problem with 7 steps. these a DATA sets you can use for the problem. if you want to use your own historical
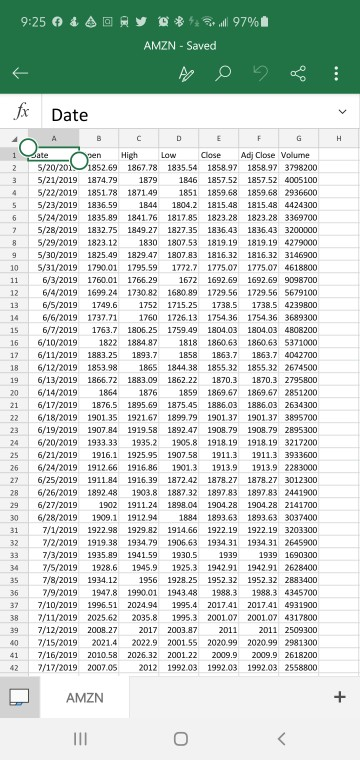
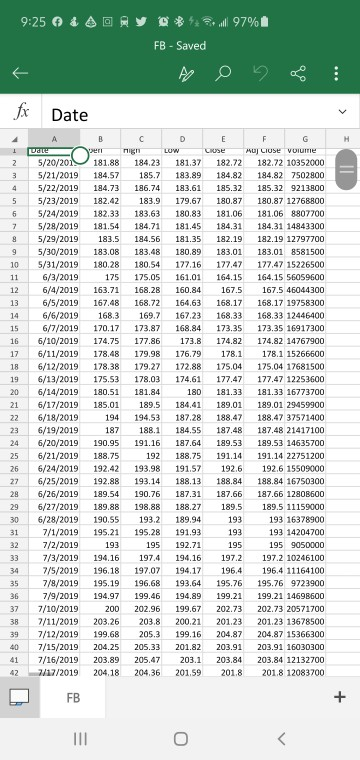
this is one problem with 7 steps. these a DATA sets you can use for the problem. if you want to use your own historical data for stock prices, you are free to do so.

from what I understand the purpose of this website is aid in the understanding of school assignments. So I do not understand the point to your asinine comment.
this is a problem for a Investments class requiring the use for excel to solve it.
this is the 3rd time in the past 3 days that I have posted this problem and all I get is excuses and not answers.
Now, does anyone on the useless site have an understanding for financial investments and EXCEL to actually help in solving this problem!?
it is one problem, with 7 steps to solve it. I have provided stock price information to use for steps 1-3 (since in previous post no one knew how it get it) if you want to use your own stock price information, you can do that too.
NO FURTHER INFORMATION SHOULD BE NEEDED BECAUSE ALL OF IT HAS BEEN PROVIDED.

you need to clarify as to what it is you people cannot comprehend about the question? because at this point, it seems clear enough and all the information as already been give.
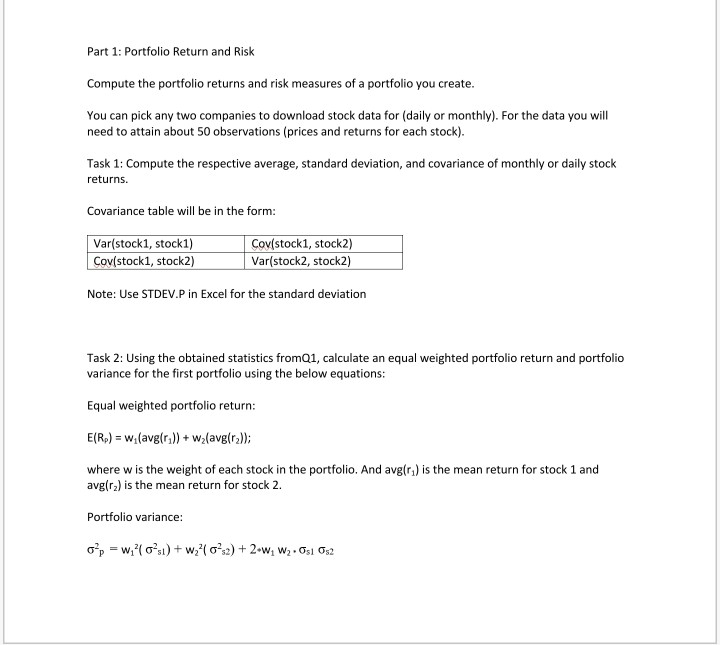
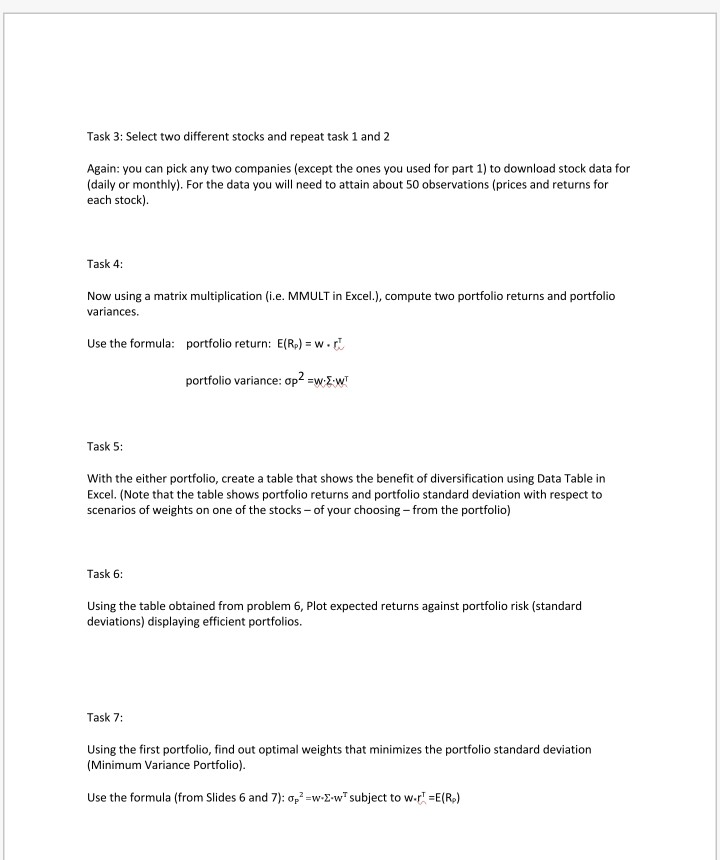
Part 1: Portfolio Return and Risk Compute the portfolio returns and risk measures of a portfolio you create. You can pick any two companies to download stock data for (daily or monthly). For the data you will need to attain about 50 observations (prices and returns for each stock). Task 1: Compute the respective average, standard deviation, and covariance of monthly or daily stock returns. Covariance table will be in the form: Var(stock1, stock1) Cov(stock1, stock2) Cov(stock1, stock2) Var(stock2, stock2) Note: Use STDEV.P in Excel for the standard deviation Task 2: Using the obtained statistics fromQ1, calculate an equal weighted portfolio return and portfolio variance for the first portfolio using the below equations: Equal weighted portfolio return: E(R) = w(avg(r.)) + Walavg(ra)); where w is the weight of each stock in the portfolio. And avg(r) is the mean return for stock 1 and avg(ra) is the mean return for stock 2. Portfolio variance: o = will 0-1) + wz? 02:2) +2.w; W2.01 0:2 Task 3: Select two different stocks and repeat task 1 and 2 Again: you can pick any two companies (except the ones you used for part 1) to download stock data for (daily or monthly). For the data you will need to attain about 50 observations (prices and returns for each stock). Task 4: Now using a matrix multiplication (i.e. MMULT in Excel.), compute two portfolio returns and portfolio variances. Use the formula: portfolio return: E(R) = W. portfolio variance: op2 =w.{-wt Task 5: With the either portfolio, create a table that shows the benefit of diversification using Data Table in Excel. (Note that the table shows portfolio returns and portfolio standard deviation with respect to scenarios of weights on one of the stocks - of your choosing - from the portfolio) Task 6: Using the table obtained from problem 6, Plot expected returns against portfolio risk (standard deviations) displaying efficient portfolios. Task 7: Using the first portfolio, find out optimal weights that minimizes the portfolio standard deviation (Minimum Variance Portfolio). Use the formula (from Slides 6 and 7): 0p2 =w-E-w" subject to w-r' =E(R) 9:25 & A all 97% AMZN - Saved Date D E F G H O 1 2 3 O 4 5 6 2 8 9 10 11 12 13 14 15 16 17 18 19 20 21 Date Wen High Low Close Adj Close Volume 5/20/20N 1852.69 1867.78 1835 54 1858.97 1858.97 3798200 5/21/2019 1874.79 1879 1846 1857.52 1857.52 4005100 5/22/2019 1851.78 1871.49 1851 1859.68 1859.68 2936600 5/23/2019 1836.59 1844 1804.2 1815.48 1815.48 4424300 5/24/2019 1835.89 1841.76 1817.85 1823.28 1823.28 3369700 5/28/2019 1832.75 1849.27 1827.35 1836.43 1836.43 3200000 5/29/2019 1823.12 1830 1807.53 1819.19 1819.19 4279000 5/30/2019 1825.49 1829.47 1807.83 1816.32 1816.32 3146900 5/31/2019 1790.01 1795.59 1772.7 1775.07 1775.07 4618800 6/3/2019 1760.01 1766.29 1672 1692.69 1692.69 9098700 6/4/2019 1699 24 1730.82 1680.89 1729.56 1729.56 5679100 6/5/2019 1749.6 1752 1715.25 1738.5 1738.5 4239800 6/6/2019 1737.21 1760 1726.13 1754.36 1754.36 3689300 6/7/2019 1763.7 1806.25 1759.49 1804.03 1804.03 4808200 6/10/2019 1822 1884.87 1818 1860.63 1860.63 5371000 6/11/2019 1883.25 1893.7 1858 1863.7 1863.7 4042700 6/12/2019 1853.98 1865 1844.38 1855.32 1855.32 2674500 6/13/2019 1866.72 1883.09 1862.22 1870.3 1870.3 2795800 6/14/2019 1864 1876 1859 1869.67 1869.67 2851200 6/17/2019 1876.5 1895.69 1875.45 1886.03 1886.03 2634300 6/18/2019 1901.35 1921.67 1899.79 1901.37 1901.37 3895700 6/19/2019 1907.84 1919.58 1892.47 1908.79 1908.79 2895300 6/20/2019 1933.33 1935.2 1905.8 1918.19 1918.19 3217200 6/21/2019 1916.1 1925.95 1907.58 1911.3 1911.3 3933600 6/24/2019 1912.66 1916.86 1901.3 1913.9 1913.9 2283000 6/25/2019 1911.84 1916.39 1872.42 1878.27 1878.27 3012300 6/26/2019 1892.48 1903.8 1887.32 1897.83 1897.83 2441900 6/27/2019 1902 1911.24 1898.04 1904.28 1904.28 2141700 6/28/2019 1909.1 1912.94 1884 1893.63 1893.63 3037400 7/1/2019 1922.98 1929.82 1914.66 1922.19 1922.19 3203300 7/2/2019 1919.38 1934.79 1906.63 1934.31 1934.31 2645900 7/3/2019 1935.89 1941.59 1930.5 1939 1939 1690300 7/5/2019 1928.6 1945.9 1925.3 1942.91 1942.91 2628400 7/8/2019 1934.12 1956 1928.25 1952.32 1952.32 2883400 7/9/2019 1947.8 1990.01 1943.48 1988.3 1988.3 4345700 7/10/2019 1996.51 2024.94 1995.4 2017.41 2017.41 4931900 7/11/2019 2025.62 2035.8 1995.3 2001.07 2001.07 4317800 7/12/2019 2008.27 2017 2003.87 2011 2011 2509300 7/15/2019 2021.4 2022.9 2001.55 2020.99 2020.99 2981300 7/16/2019 2010.58 2026.32 2001,22 2009.9 2009.9 2618200 7/17/2019 2007.05 2012 1992.03 1992.03 1992.03 2558800 22 23 24 25 26 27 28 29 30 31 32 33 34 35 36 37 38 39 40 41 42 + AMZN III
Step by Step Solution
There are 3 Steps involved in it

Get step-by-step solutions from verified subject matter experts