

Question: This is part b Figure 7.27 shows a flow network on which an s-t flow has been computed. The capacity of each edge appears as
This is part b
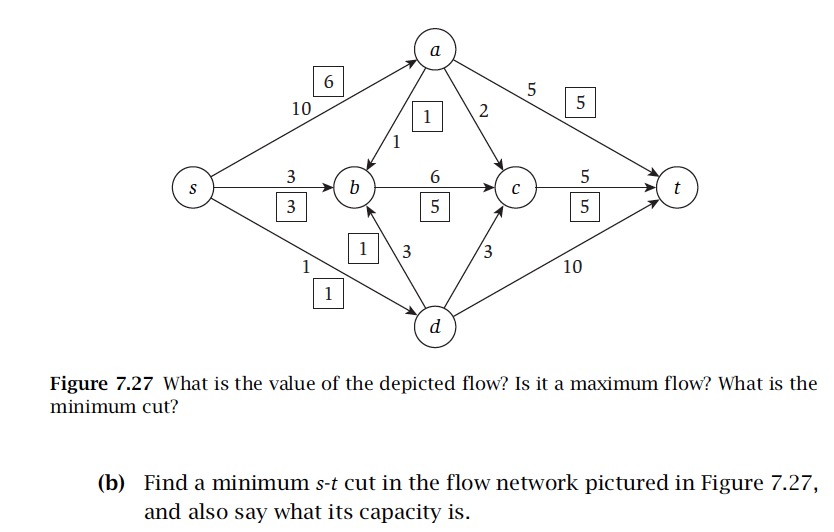
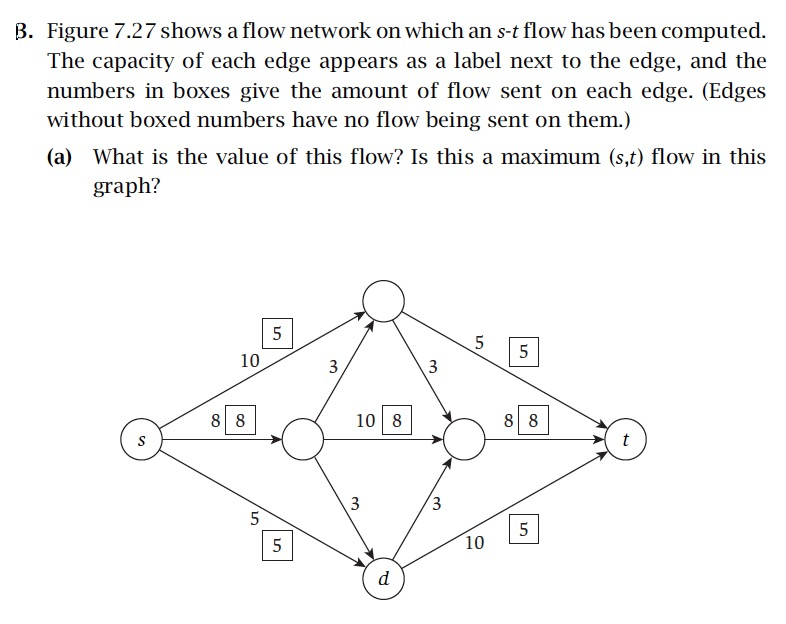
Figure 7.27 shows a flow network on which an s-t flow has been computed. The capacity of each edge appears as a label next to the edge, and the numbers in boxes give the amount of flow sent on each edge. (Edges without boxed numbers have no flow being sent on them.) (a) What is the value of this flow? Is this a maximum (s,t) flow in this B. graph? 10 1018 10
Step by Step Solution
There are 3 Steps involved in it
1 Expert Approved Answer
Step: 1 Unlock

Question Has Been Solved by an Expert!
Get step-by-step solutions from verified subject matter experts
Step: 2 Unlock
Step: 3 Unlock