

Question: The figure below shows a flow network on which an s-t flow has been computed. The capacity of each edge appears as a label
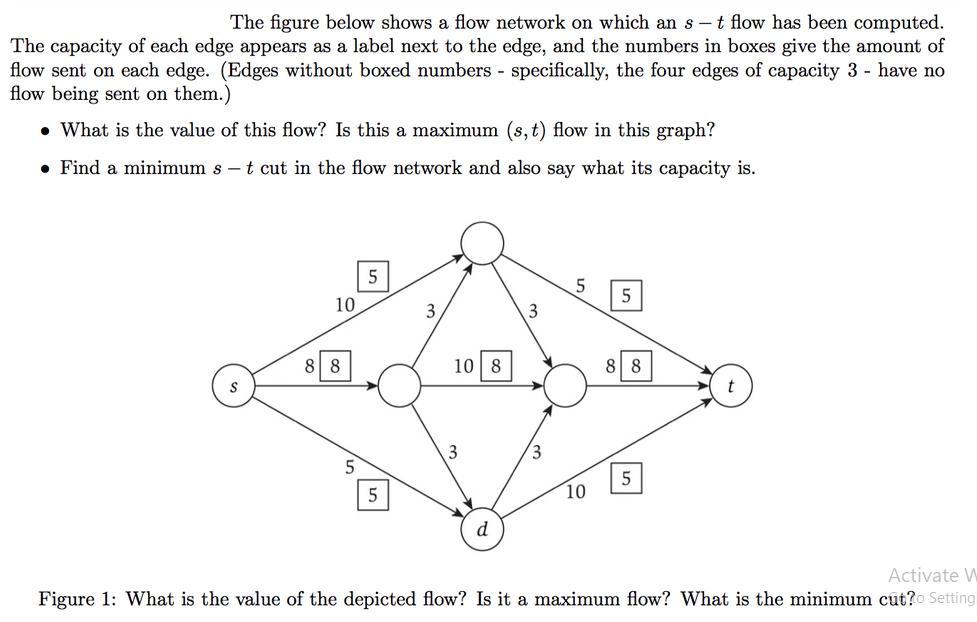
The figure below shows a flow network on which an s-t flow has been computed. The capacity of each edge appears as a label next to the edge, and the numbers in boxes give the amount of flow sent on each edge. (Edges without boxed numbers - specifically, the four edges of capacity 3- have no flow being sent on them.) What is the value of this flow? Is this a maximum (s, t) flow in this graph? Find a minimum s - t cut in the flow network and also say what its capacity is. S 10 8 8 5 5 5 3 10 8 3 d 3 5 10 5 8 8 5 Activate W Figure 1: What is the value of the depicted flow? Is it a maximum flow? What is the minimum cut?o Setting
Step by Step Solution
3.38 Rating (148 Votes )
There are 3 Steps involved in it

Get step-by-step solutions from verified subject matter experts