

Question: This is purely for a learning purpose, and I have a couple of questions prepared to determine why I got these questions wrong (pictures included):
This is purely for a learning purpose, and I have a couple of questions prepared to determine why I got these questions wrong (pictures included):
It would be great if you could answer my questions with sufficient explanation! Thank you:)
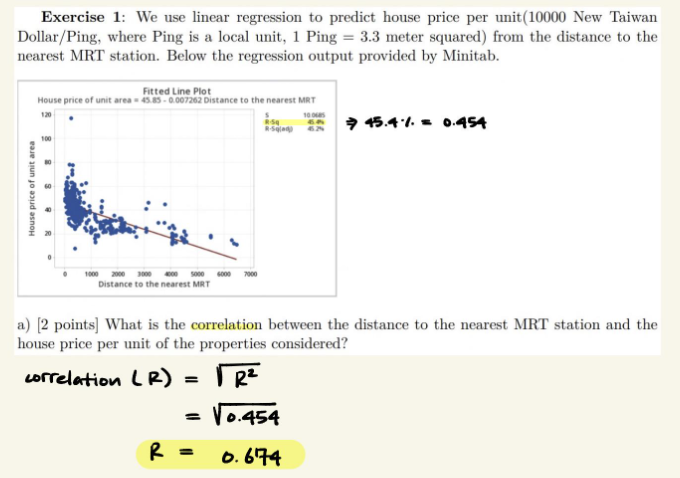
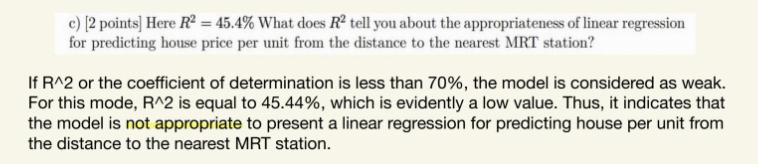
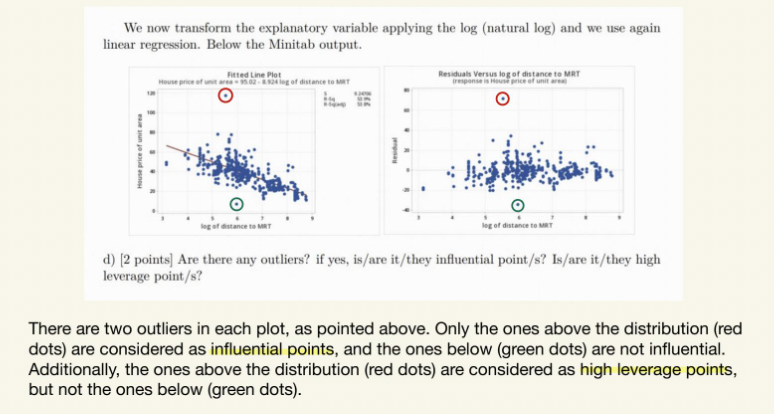
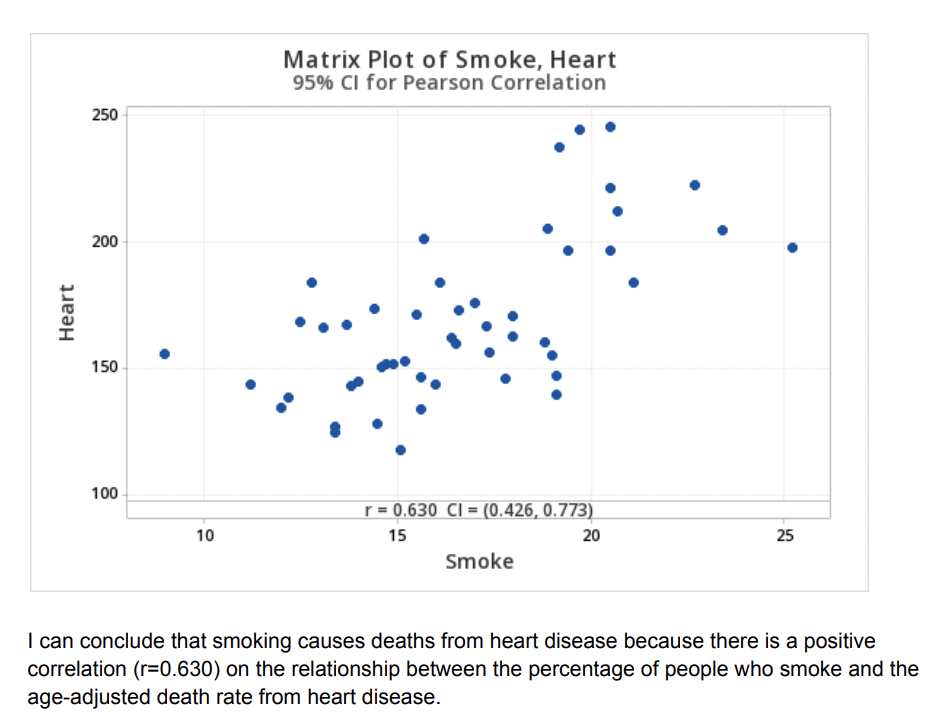

Exercise 1: We use linear regression to predict house price per unit(10000 New Taiwan Dollar/Ping, where Ping is a local unit, 1 Ping = 3.3 meter squared) from the distance to the nearest MRT station. Below the regression output provided by Minitab. Fitted Line Plot House price of unit area = 43.83 - 0.097262 Distance to the nearest MRT 7 45.4% = 0.454 180 House price of unit area 1 4 5000 4000 Distance to the nearest MART a) [2 points] What is the correlation between the distance to the nearest MRT station and the house price per unit of the properties considered? correlation ( R ) = 1 RZ = Vo.454 R = 0. 674c) [2 points] Here R2 = 45.4% What does R? tell you about the appropriateness of linear regression for predicting house price per unit from the distance to the nearest MRT station? If R^2 or the coefficient of determination is less than 70%, the model is considered as weak. For this mode, R^2 is equal to 45.44%, which is evidently a low value. Thus, it indicates that the model is not appropriate to present a linear regression for predicting house per unit from the distance to the nearest MRT station.We now transform the explanatory variable applying the log (natural log) and we use again linear regression. Below the Minitab output. Fitted Line Plot Residual Versus log of distance to MRT House price of unit area - 15 02 - Bidding of distance to LET response in House price of unit areal O O House price of unit area log of distance to MAT log of distance to MAT d) [2 points] Are there any outliers? if yes, is/are it/they influential point/s? Is/are it/they high leverage point/s? There are two outliers in each plot, as pointed above. Only the ones above the distribution (red dots) are considered as influential points, and the ones below (green dots) are not influential. Additionally, the ones above the distribution (red dots) are considered as high leverage points, but not the ones below (green dots).Matrix Plot of Smoke, Heart 95% CI for Pearson Correlation 250 g 0 O . O O O O 200 . . . ,. H o o o E o . o. . W O . O Q 150 * o o '0 : O. O . I O 100 r = 0.63!) CI = (0.426, 0.773] 10 15 20 25 Smoke I can conclude that smoking causes deaths from heart disease because there is a positive correlation (r=0.630) on the relationship between the percentage of people who smoke and the age-adjusted death rate from heart disease. Is the relationship that you observed in response to the previous question sufficient to prove that smoking causes deaths from heart disease? Explain your
Step by Step Solution
There are 3 Steps involved in it

Get step-by-step solutions from verified subject matter experts