

Question: This is python code written on jupyter notebook. which produces the following graph. Can the the points on the graph be connected with a line,
This is python code written on jupyter notebook.
which produces the following graph.
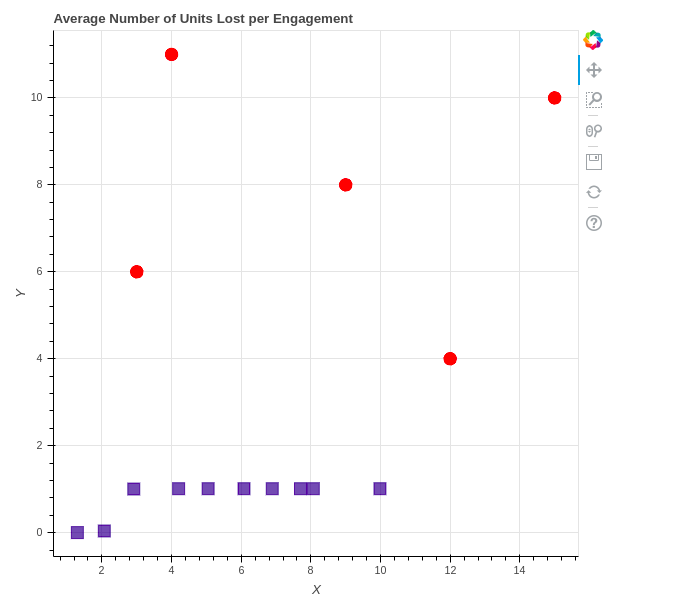
Can the the points on the graph be connected with a line, all the blue points connected to each other and then all the red points connected to each other.
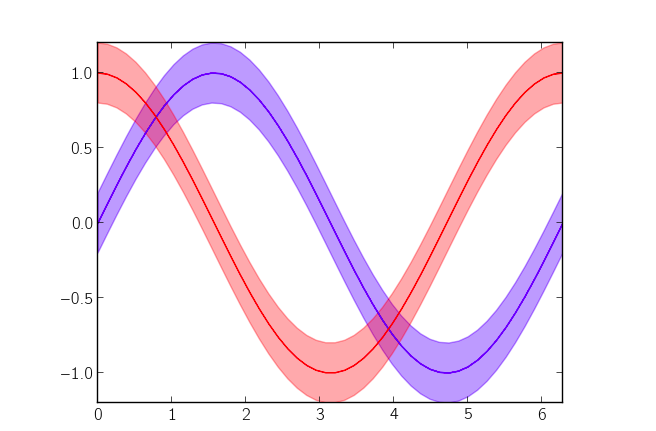
Can error be added nto the plot, can it be shaded like it is in the following plot. can the value for the error be 1.5.
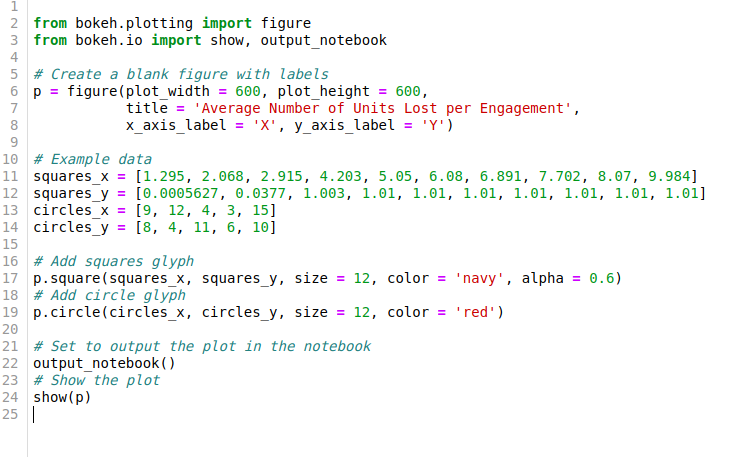
 from bokeh.plotting import figure from bokeh.io import show, output_notebook
# Create a blank figure with labels p = figure(plot_width = 600, plot_height = 600, title = 'Average Number of Units Lost per Engagement', x_axis_label = 'X', y_axis_label = 'Y') # Example data squares_x = [1.295, 2.068, 2.915, 4.203, 5.05, 6.08, 6.891, 7.702, 8.07, 9.984] squares_y = [0.0005627, 0.0377, 1.003, 1.01, 1.01, 1.01, 1.01, 1.01, 1.01, 1.01] circles_x = [9, 12, 4, 3, 15] circles_y = [8, 4, 11, 6, 10]
# Add squares glyph p.square(squares_x, squares_y, size = 12, color = 'navy', alpha = 0.6) # Add circle glyph p.circle(circles_x, circles_y, size = 12, color = 'red')
# Set to output the plot in the notebook output_notebook() # Show the plot show(p)
2 from bokeh.plotting import figure 3 from bokeh.io import show, output_notebook 5 # Create a blank figure with labels 6 p-figure(plot width- 600, plot_height600, title-'Average Number of Units Lost per Engagement', x axis label "?, y axis label ) 10 # Example data 11 squaresx[1.295, 2.068, 2.915, 4.03, 5.05, 6.08, 6.891, 7.702, 8.07, 9.984] 12 squares-y= [0.0005627, ?0377, 1.0?3, 1.01, 1.01, 1.01, 1.01, 1.01, 1.01, 1.01] 13 circles_x[9, 12, 4, 3, 15] 14 circles y [8, 4, 11, 6, 10] 15 16 # Add squares glyph 17 ?.square ( squares-x, squares-y , size- 12, color- 'navy, alpha-0.6) 18 # Add circle glyph 19 p.circle(circles_x, circles_y, size-12, color'red') 20 21 # Set to output the plot in the notebook 22 output_notebok) 23 # Show the plot 24 show(p) 25 2 2 8 2 3
Step by Step Solution
There are 3 Steps involved in it

Get step-by-step solutions from verified subject matter experts