

Question: This is statistics course and I need help with solving these questions. It's Hypothesis Testing for a Mean and Two Proportions unit. D Question 2
This is statistics course and I need help with solving these questions. It's Hypothesis Testing for a Mean and Two Proportions unit.
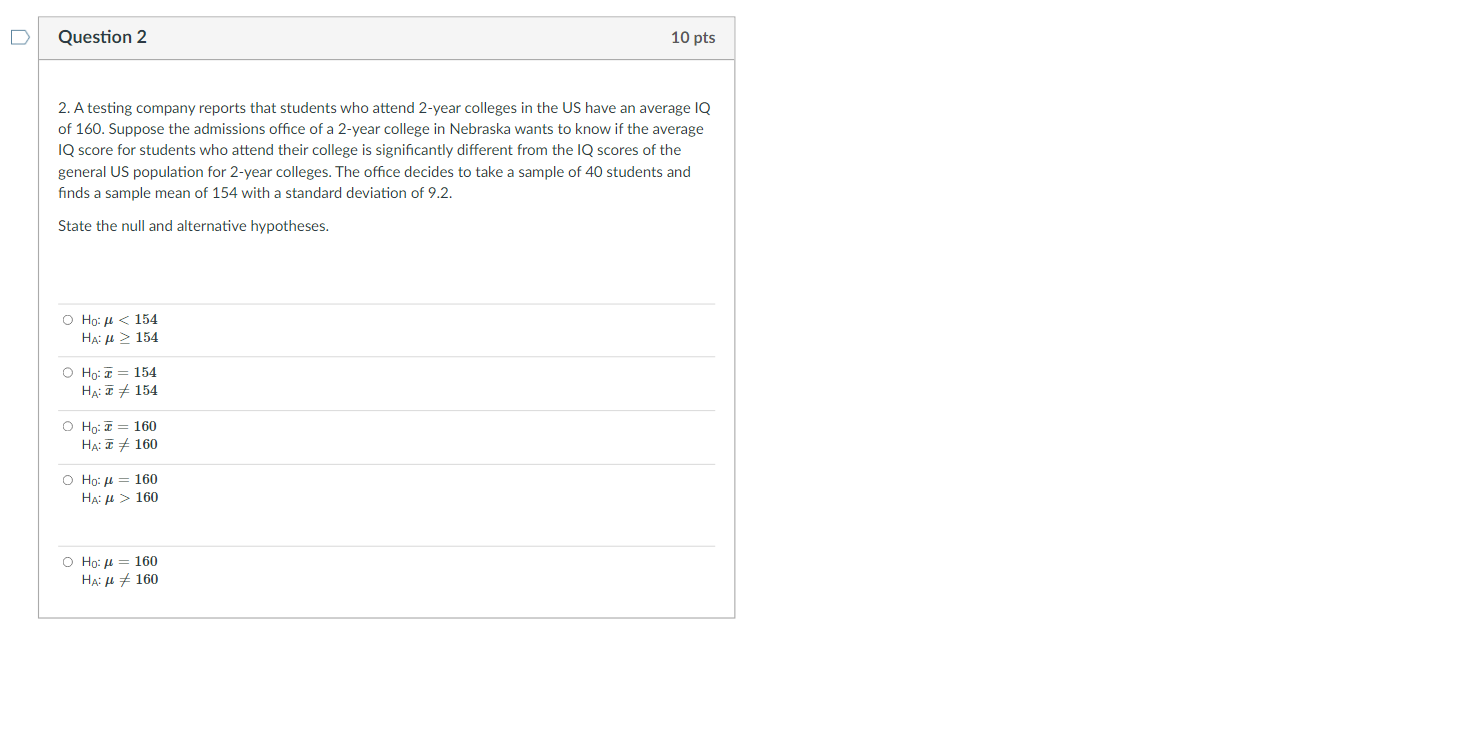
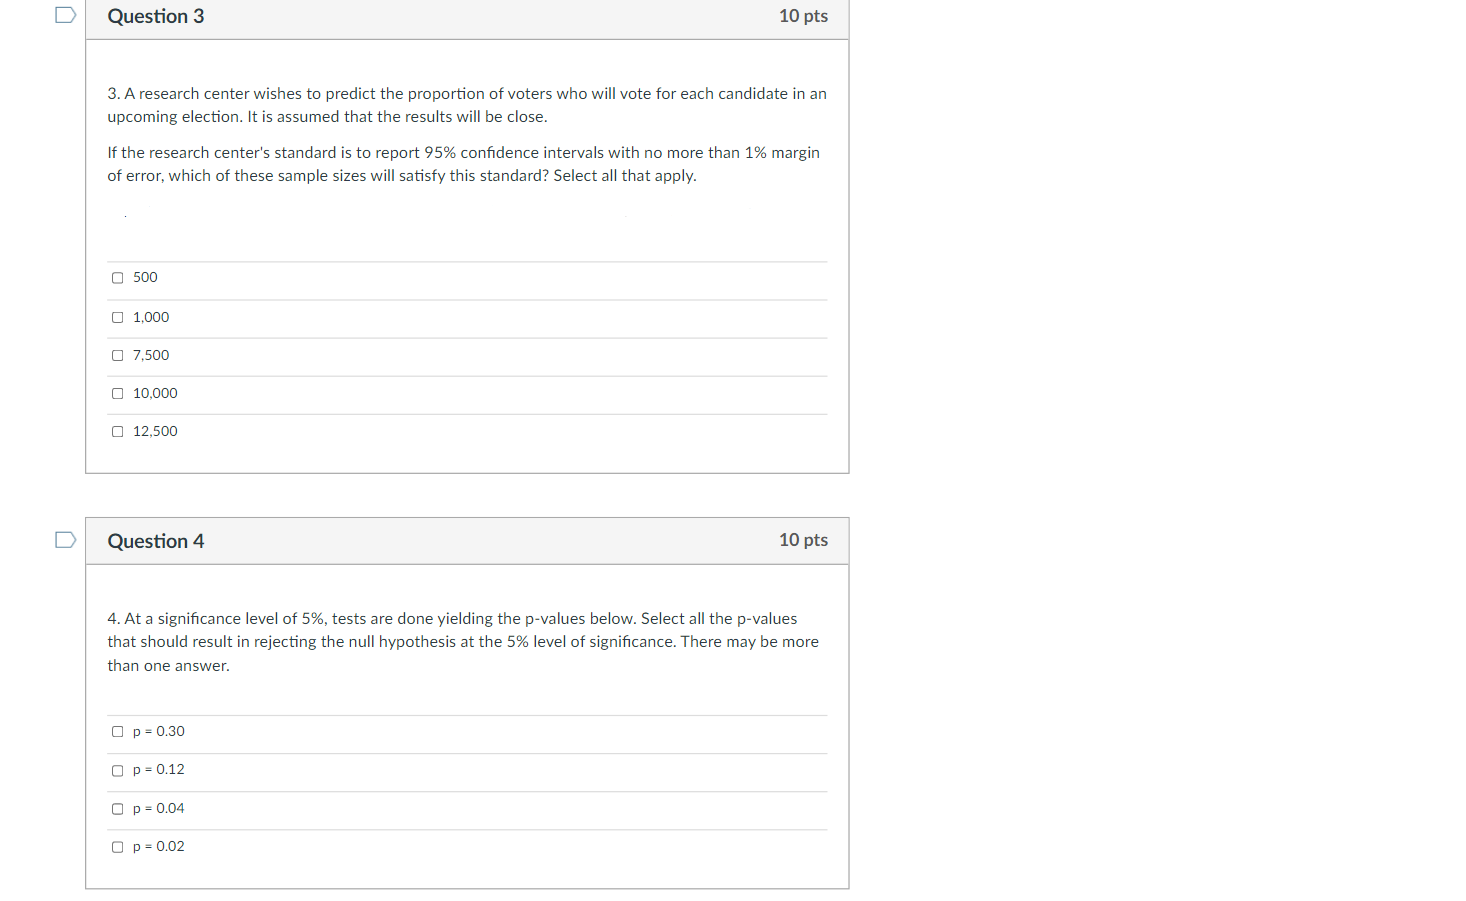
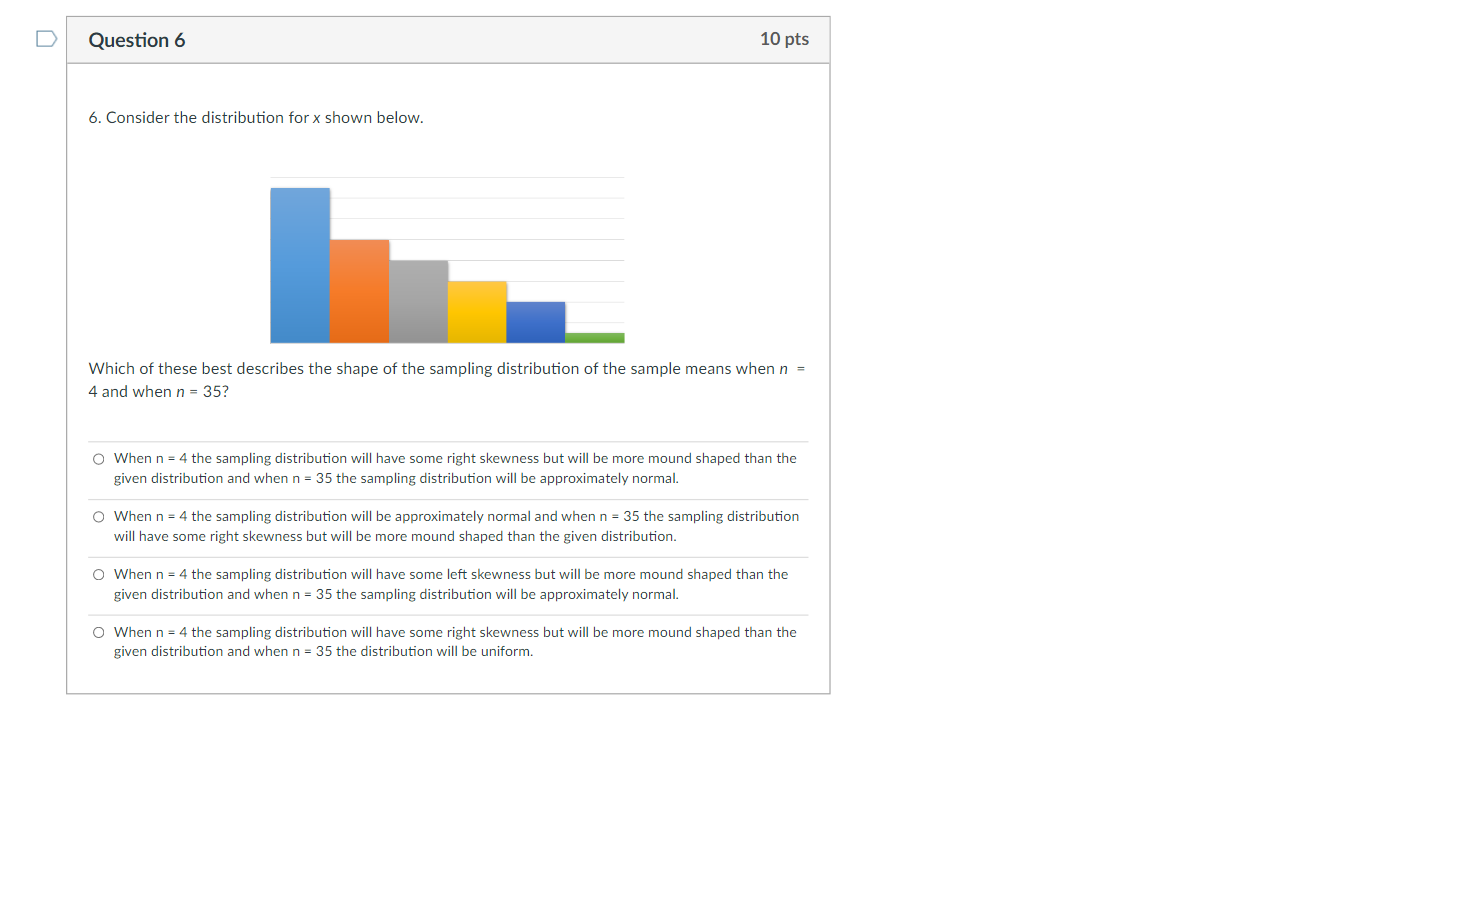
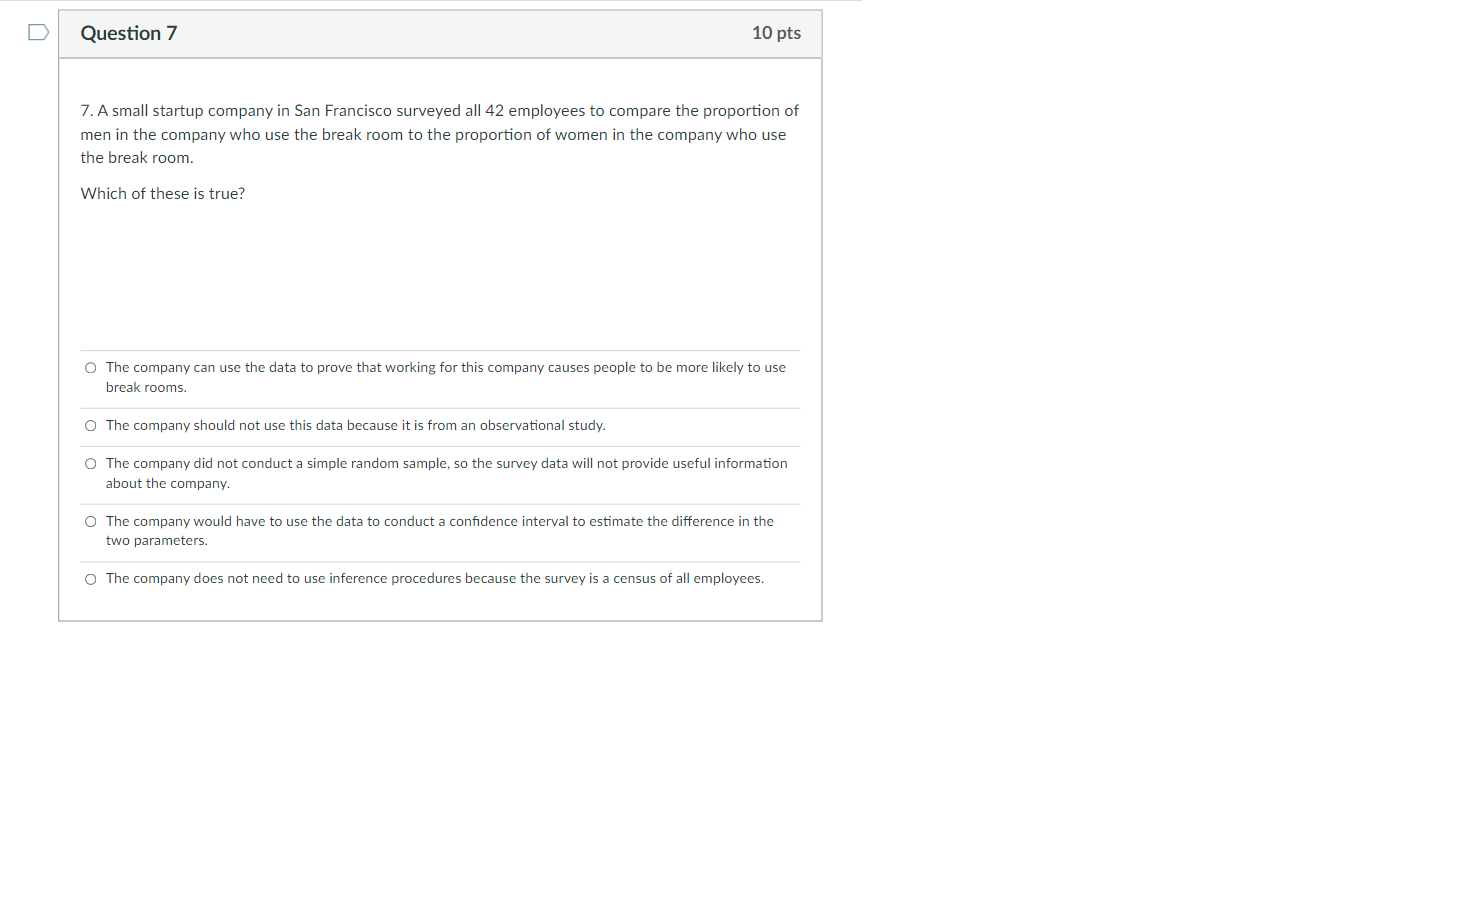
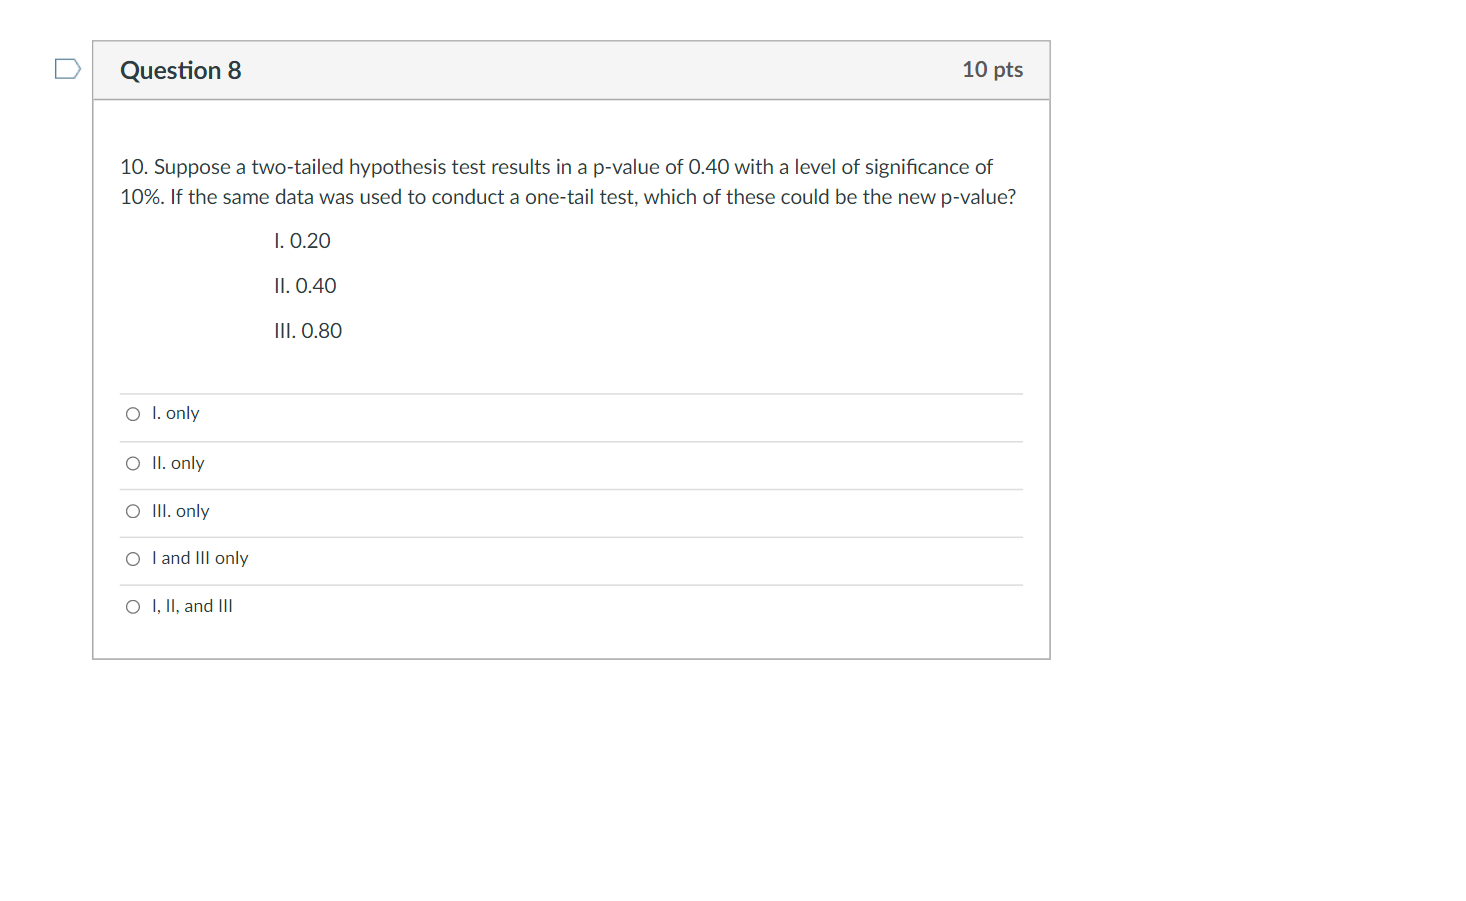
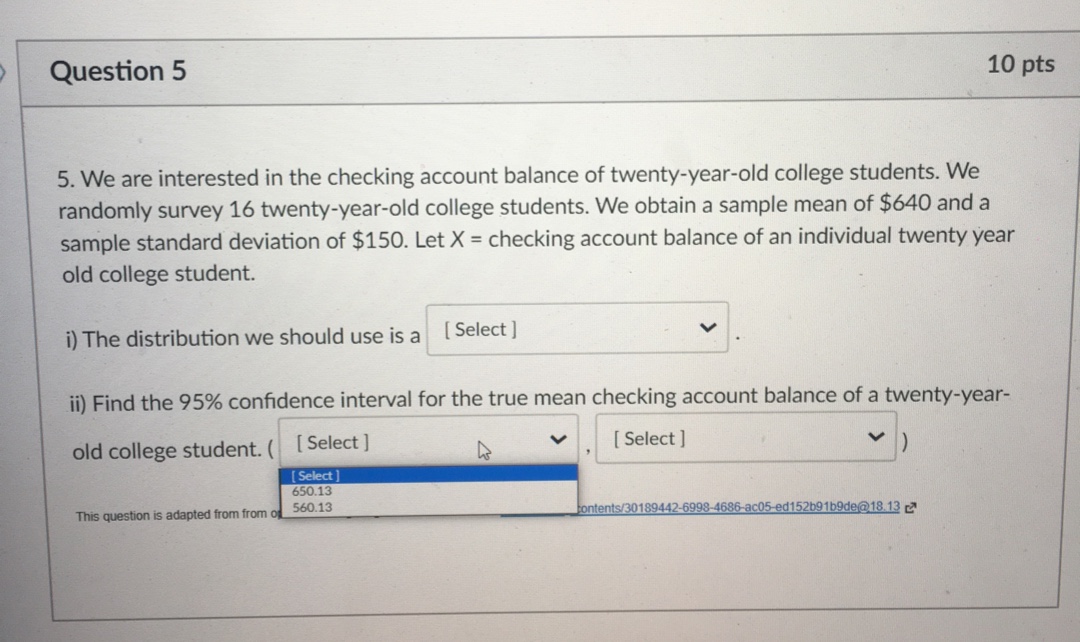
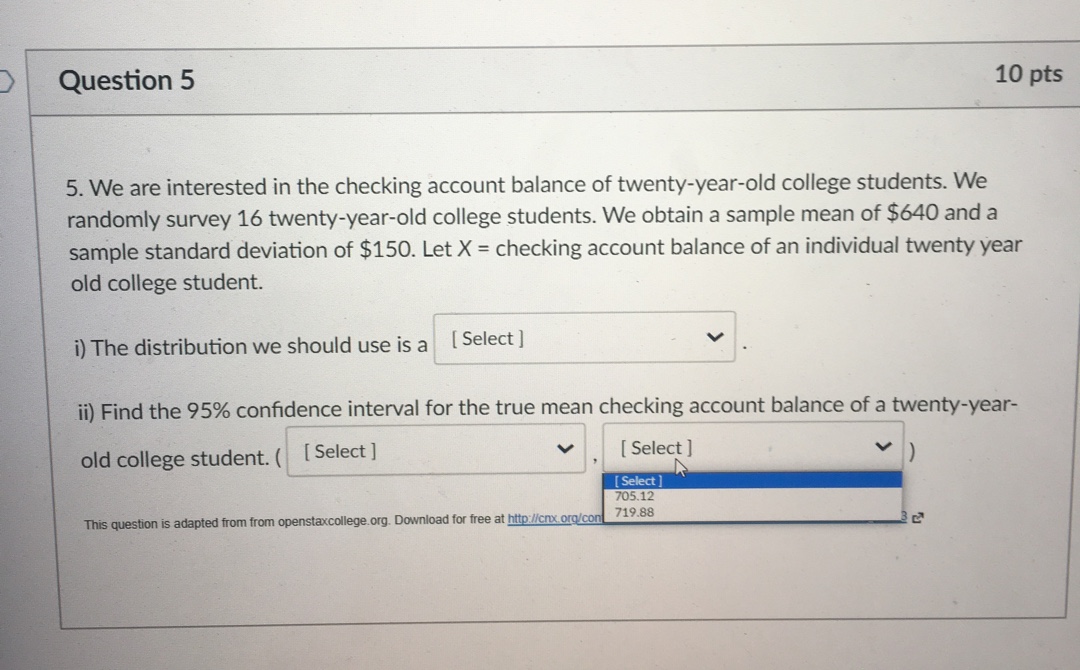
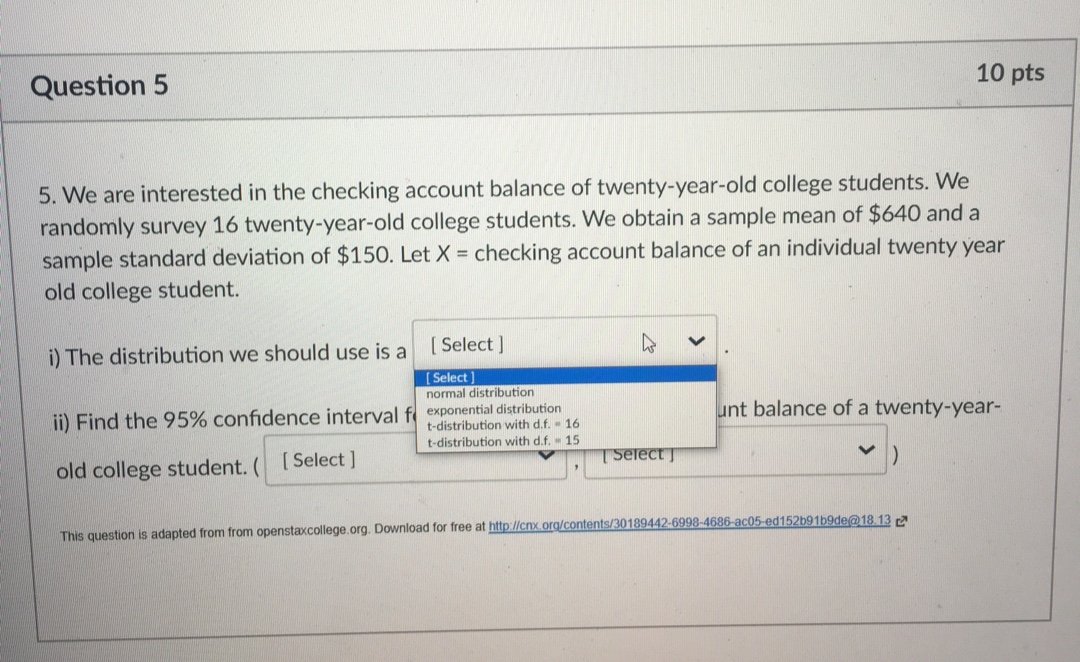
D Question 2 10 pts 2. A testing company reports that students who attend 2-year colleges in the US have an average IQ of 160. Suppose the admissions office of a 2-year college in Nebraska wants to know if the average IQ score for students who attend their college is significantly different from the IQ scores of the general US population for 2-year colleges. The office decides to take a sample of 40 students and finds a sample mean of 154 with a standard deviation of 9.2. State the null and alternative hypotheses. O Ho: u 154 O Ho: I = 154 HA: I # 154 O Ho: I = 160 HA: I # 160 O Ho: / = 160 HA:/ > 160 O Ho: / = 160 HA: # # 160D Question 3 10 pts 3. A research center wishes to predict the proportion of voters who will vote for each candidate in an upcoming election. It is assumed that the results will be close. If the research center's standard is to report 95% confidence intervals with no more than 1% margin of error, which of these sample sizes will satisfy this standard? Select all that apply. 0 500 0 1,000 0 7,500 10,000 0 12,500 D Question 4 10 pts 4. At a significance level of 5%, tests are done yielding the p-values below. Select all the p-values that should result in rejecting the null hypothesis at the 5% level of significance. There may be more than one answer. O p = 0.30 O p = 0.12 O p = 0.04 O p = 0.02Question 6 10 pts 6. Consider the distribution for)! shown below. Which of these best describes the shape of the sampling distribution of the sample means when n e 4 and when n = 35? Q When n = 4 the sampling distribution will have some right skewness but will be more mound shaped than the given dls rlhution and when n = 35 the sampling distribution will be approximately normal. 0 When n = 4 the sampling distribution will be approximately normal and when n = 35 the sampling distribution will have some right skewness but will be more mound shaped than the given distribution. 0 When n = 4 the sampling distribution will have some left skewness but will he more mound shaped than the given distribution and when n = 35 the sampling distribution will be approximately normal. 0 When n = 4 the sampling distribution will have some right skewness but will be more mound shaped than the given d hun'on and when n = 35 the distribution will be uniform. Question 7 10 pts 7.A small startup company in San Francisco surveyed all 42 employees to compare the proporon of men in the company who use the break room to the proportion of women in the company who use the break room. Which of these is true? 0 The company can use the data to prove that working for this company causes people to he more likely to use break rooms. 0 The company should not use this data because it is from an observational study: 0 The company did not conduct a simple random sample, so the survey data will not provide useful information about the company. 0 The company would have to use the data to conduct a condence interval to estimate the difference in the two parameters. 0 The company does not need to use inference procedures because the survey is a census of all employees. D Question 8 10 pts 10. Suppose a two-tailed hypothesis test results in a p-value of 0.40 with a level of significance of 10%. If the same data was used to conduct a one-tail test, which of these could be the new p-value? 1. 0.20 II. 0.40 III. 0.80 O I. only O Il. only O Ill. only O I and Ill only O I, Il, and IllQuestion 5 10 pts 5. We are interested in the checking account balance of twenty-year-old college students. We randomly survey 16 twenty-year-old college students. We obtain a sample mean of $640 and a sample standard deviation of $150. Let X = checking account balance of an individual twenty year old college student. i) The distribution we should use is a [Select ] ii) Find the 95% confidence interval for the true mean checking account balance of a twenty-year- old college student. ( [ Select ] [ Select ] [ Select ] 650.13 This question is adapted from from of 560.13 contents/30189442-6998-4686-ac05-ed152b91b9de@18.13[Question 5 10 pts 5. We are interested in the checking account balance of twenty-year-old college students. We randomly survey 16 twenty-year-old college students. We obtain a sample mean of $640 and a sample standard deviation of $150. Let X = checking account balance of an individual twenty year old college student. i) The distribution we should use is a [ Select ] ii) Find the 95% confidence interval for the true mean checking account balance of a twenty-year- old college student. ( [ Select ] [ Select ] [ Select 705.12 This question is adapted from from openstaxcollege. org. Download for free at http://cnix.org/conf 719.88Question 5 10 pts 5. We are interested in the checking account balance of twenty-year-old college students. We randomly survey 16 twenty-year-old college students. We obtain a sample mean of $640 and a sample standard deviation of $150. Let X = checking account balance of an individual twenty year old college student. i) The distribution we should use is a [ Select ] Select ] normal distribution ii) Find the 95% confidence interval f exponential distribution t-distribution with d.f. - 16 unt balance of a twenty-year- t-distribution with d.f. - 15 old college student. ( [ Select ] [Select ] This question is adapted from from openstaxcollege.org. Download for free at http://cox.org/contents/30189442-6998-4686-ac05-ed152b91b9de@18.132
Step by Step Solution
There are 3 Steps involved in it

Get step-by-step solutions from verified subject matter experts