

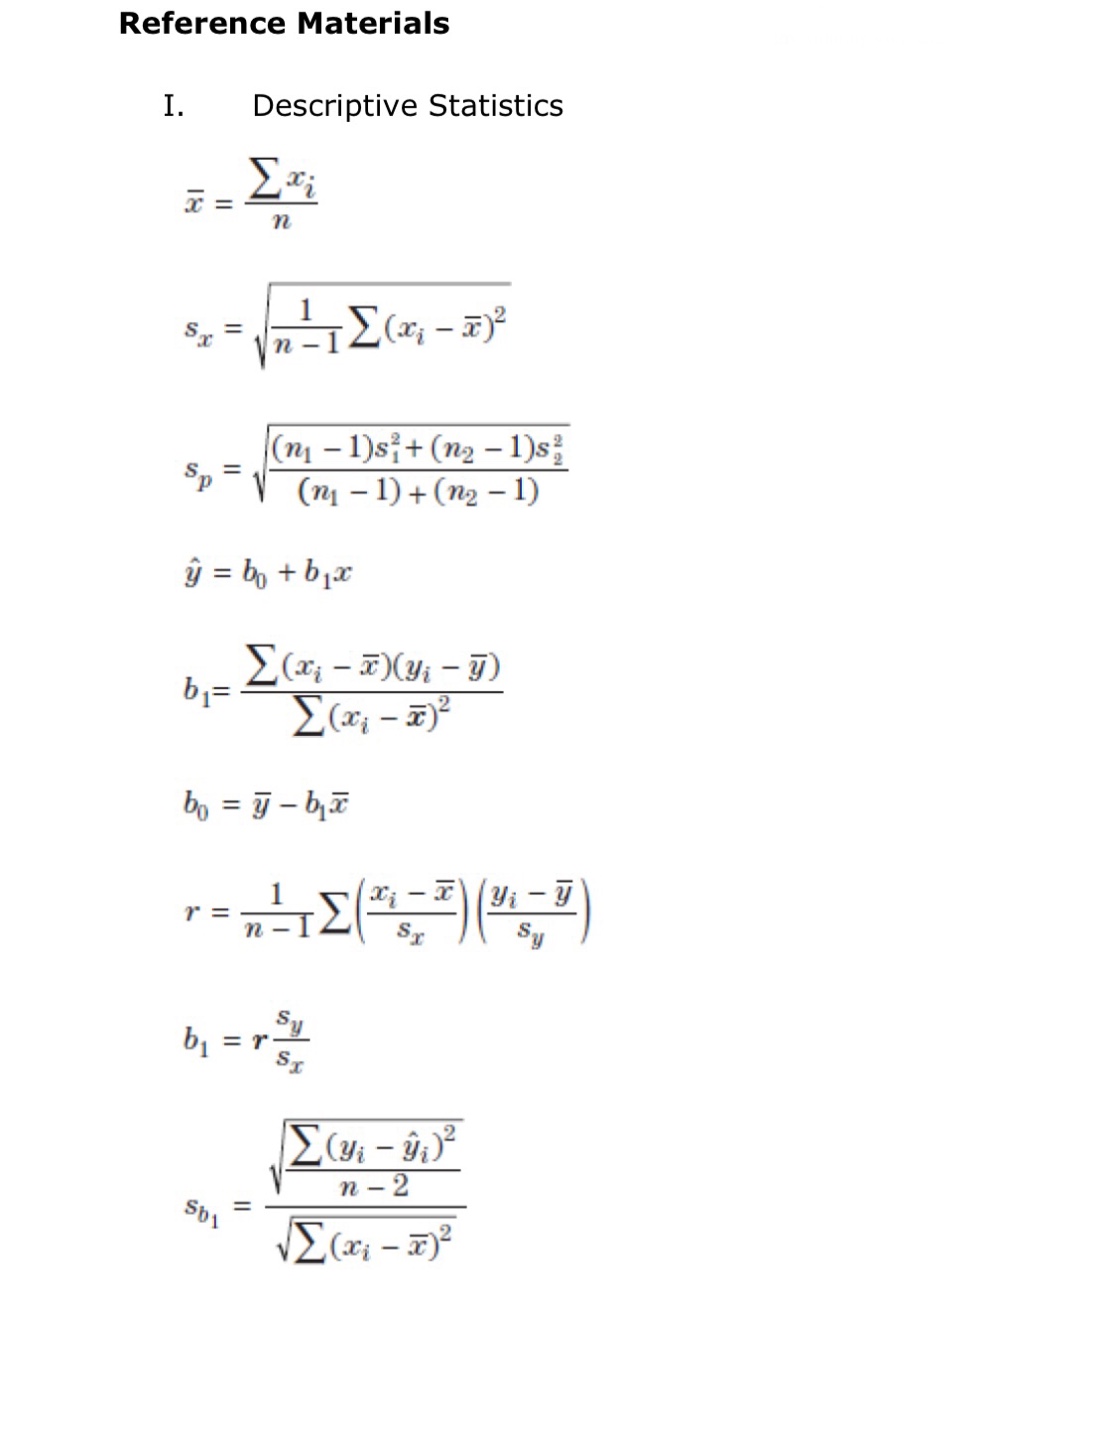
Question: This is statistics course, sampling distributions, estimation and tests of significance units.I need help with this. I attached formula sheet in case you need it.

This is statistics course, sampling distributions, estimation and tests of significance units.I need help with this. I attached formula sheet in case you need it.
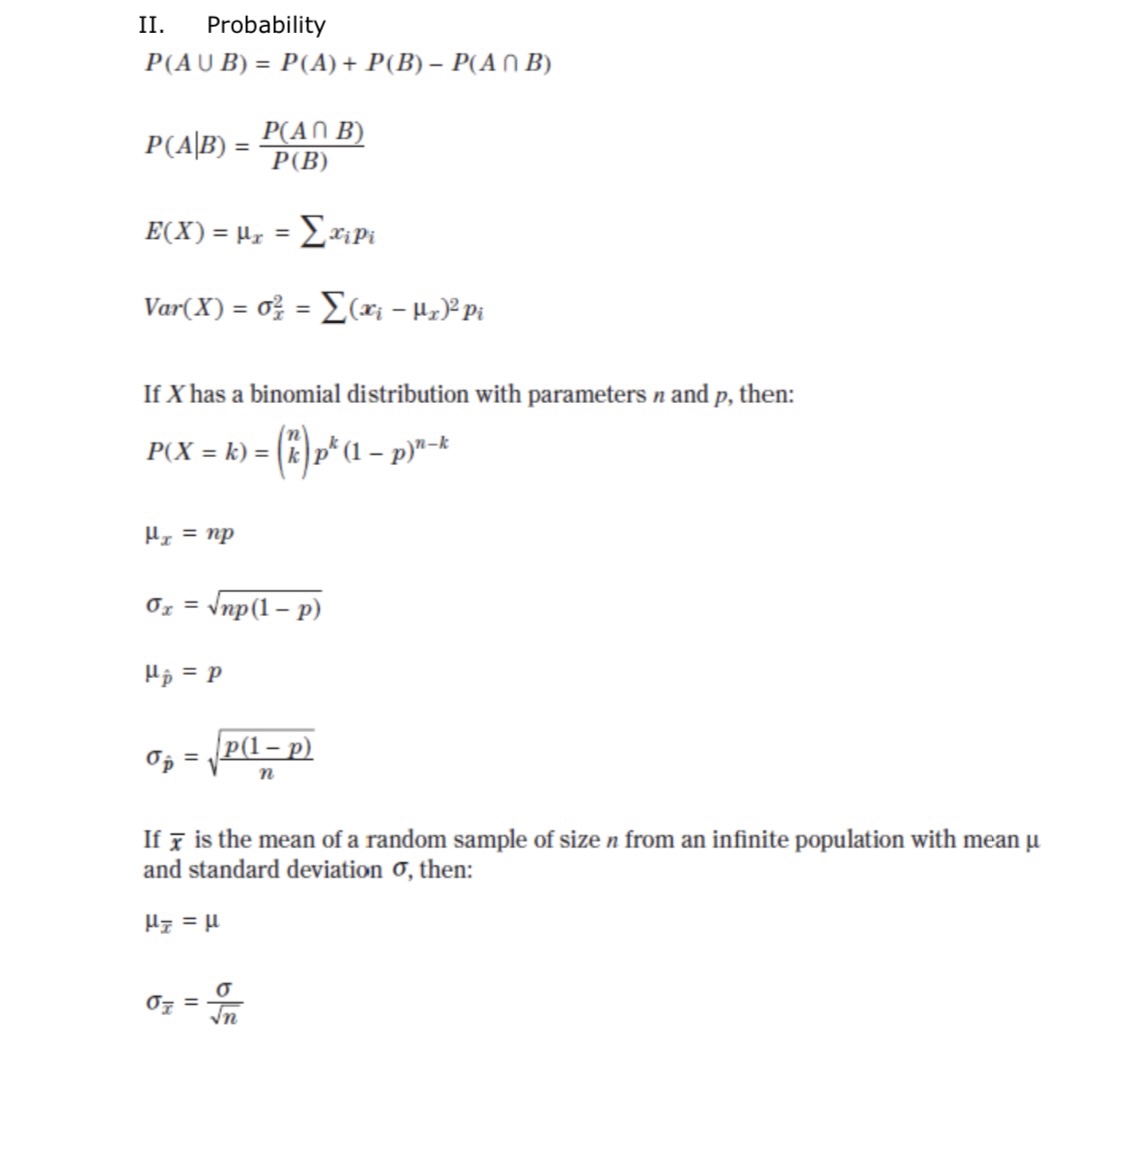


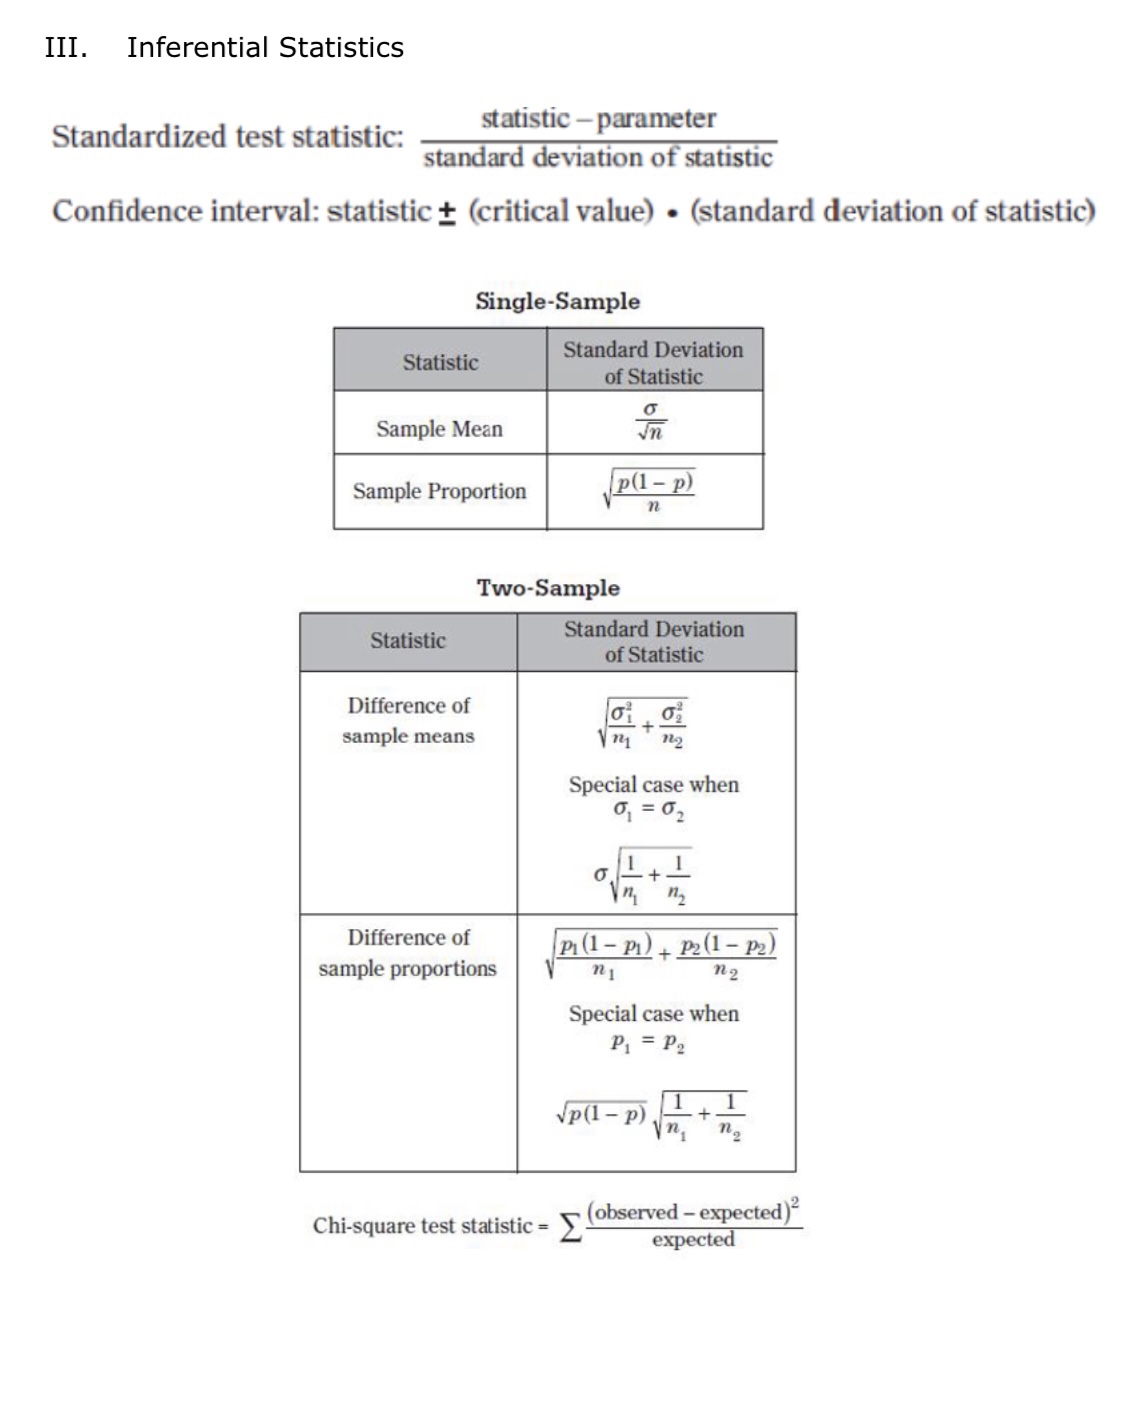
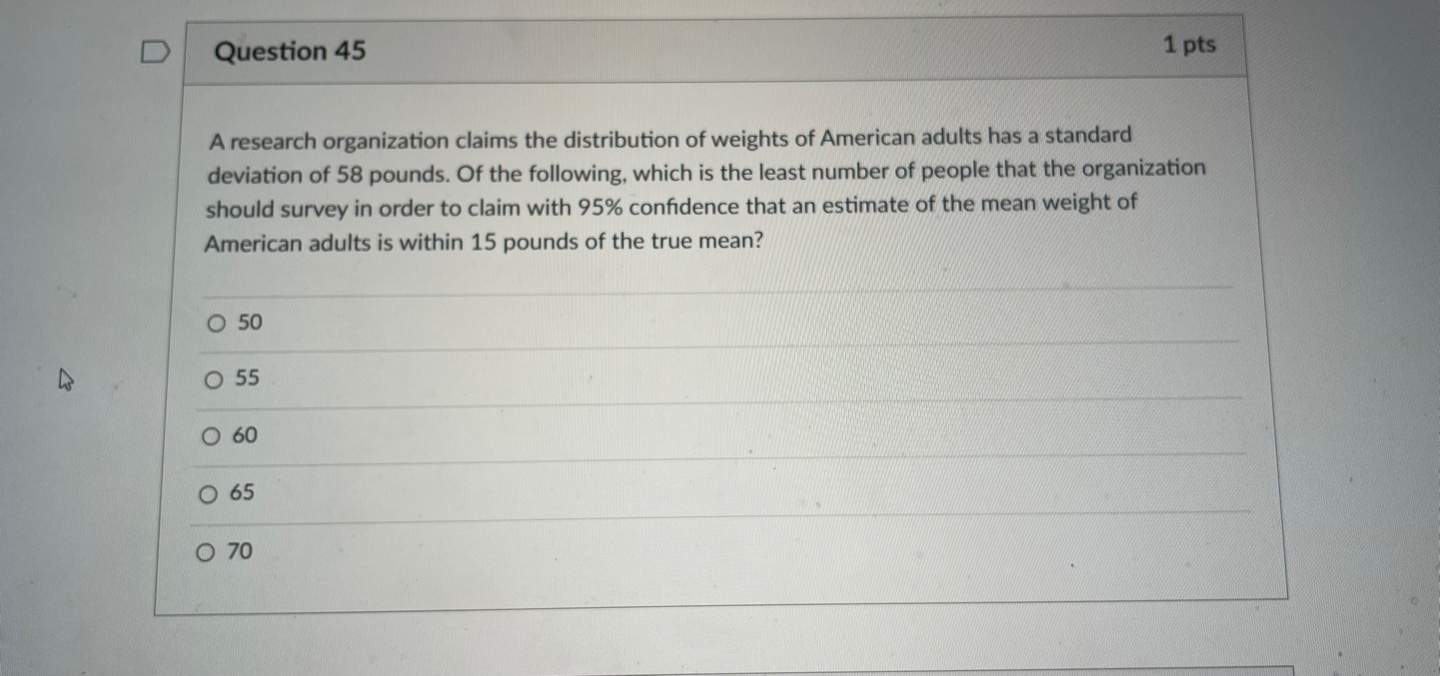
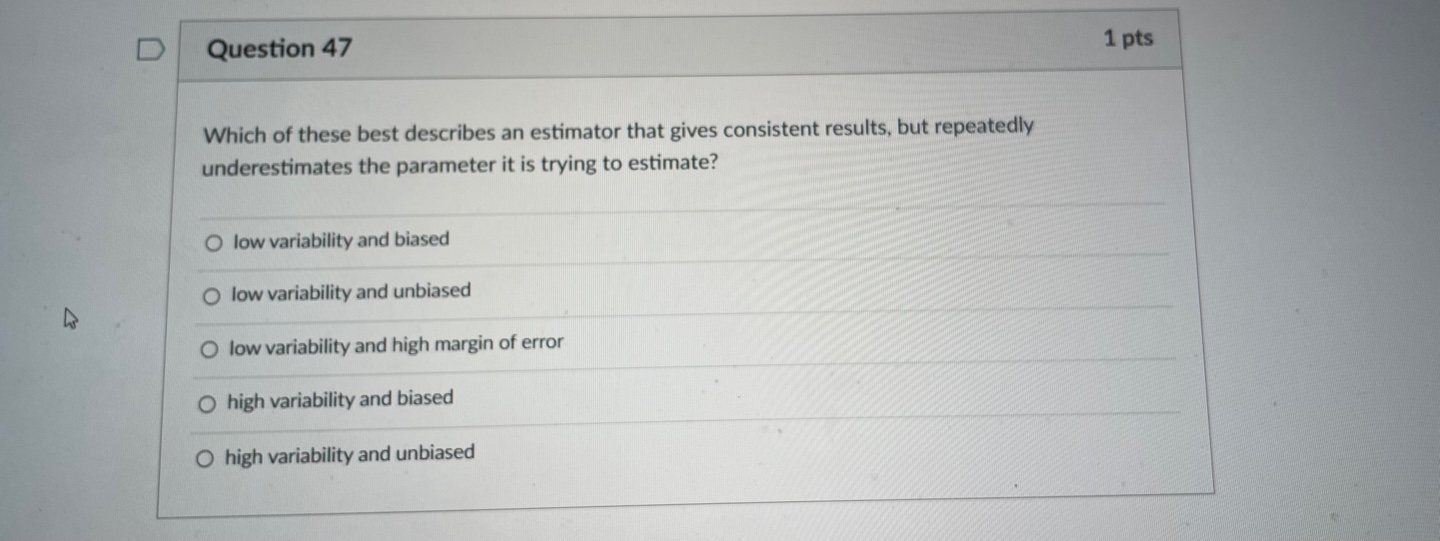
II. Probability P(AUB) = P(A) + P(B) - P(An B) P(AB) = P(An B) P(B) E(X) = Ux = Expi Var(X) = 0; = _(x - ux)2pi If X has a binomial distribution with parameters n and p, then: P(X = k) = k) p* (1 - p)" -* HI = np Or = Vnp(1 - p) Ho = P Op = P(1- p n If x is the mean of a random sample of size n from an infinite population with mean u and standard deviation O, then: MY = HIII. Inferential Statistics Standardized test statistic: statistic - parameter standard deviation of statistic Confidence interval: statistic + (critical value) . (standard deviation of statistic) Single-Sample Statistic Standard Deviation of Statistic Sample Mean Sample Proportion p(1 - p) n Two-Sample Statistic Standard Deviation of Statistic Difference of sample means 722 Special case when 61 =02 ol+1 n2 Difference of PI (1 - PI) + P2 (1 - P2) sample proportions n1 n2 Special case when P1 = P2 Jp(1 - P) 1 + 1 Vn, n2 Chi-square test statistic = \\ (observed - expected) expected\fD Question 45 1 pts A research organization claims the distribution of weights of American adults has a standard deviation of 58 pounds. Of the following, which is the least number of people that the organization should survey in order to claim with 95% confidence that an estimate of the mean weight of American adults is within 15 pounds of the true mean? 50 O 55 60 O 65 O 70D Question 47 1 pts Which of these best describes an estimator that gives consistent results, but repeatedly underestimates the parameter it is trying to estimate? low variability and biased low variability and unbiased O low variability and high margin of error high variability and biased O high variability and unbiased
Step by Step Solution
There are 3 Steps involved in it

Get step-by-step solutions from verified subject matter experts