

Question: This is Statistics. In Table 4.2, supply the table in sample number 62 to 66 to complete the table Example 16. Consider the following hypothetical
This is Statistics. In Table 4.2, supply the table in sample number 62 to 66 to complete the table
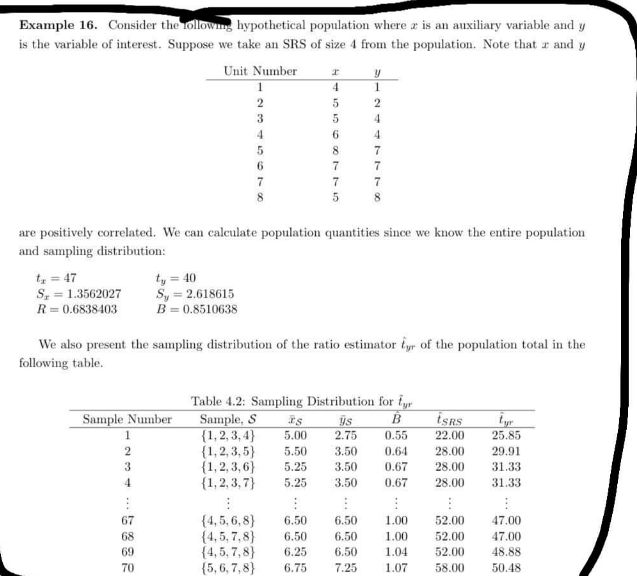
Example 16. Consider the following hypothetical population where a is an auxiliary variable and y is the variable of interest. Suppose we take an SRS of size 4 from the population. Note that r and y Unit Number are positively correlated. We can calculate population quantities since we know the entire population and sampling distribution: to = 47 ty = 40 S. = 1.3562027 ST = 2.618615 R = 0.6838403 B = 0.8510638 We also present the sampling distribution of the ratio estimator fyr of the population total in the following table. Table 4.2: Sampling Distribution for , Sample Number Sample, S ys B tSRS tyr {1, 2, 3,4} 5.00 2.75 0.55 22.00 25.85 (1, 2, 3,5) 5.50 3.50 0.64 28.00 29.91 (1, 2. 3,6} 5.25 3.50 0.67 28.00 31.33 (1, 2, 3, 7} 5.25 3.50 0.67 28.00 31.33 67 (4, 5, 6,8} 6.50 6.50 1.00 52.00 47.00 68 (4, 5, 7,8] 6.50 6.50 1.00 52.00 47.00 69 (4, 5, 7,8} 6.25 6.50 1.04 52.00 48.88 70 (5, 6, 7,8) 6.75 7.25 1.07 58.00 50.48
Step by Step Solution
There are 3 Steps involved in it

Get step-by-step solutions from verified subject matter experts