

Question: This is Statistics. in Table 4.2, supply the Example 16. Consider the following hypothetical population where a is an auxiliary variable and y is the
This is Statistics. in Table 4.2, supply the
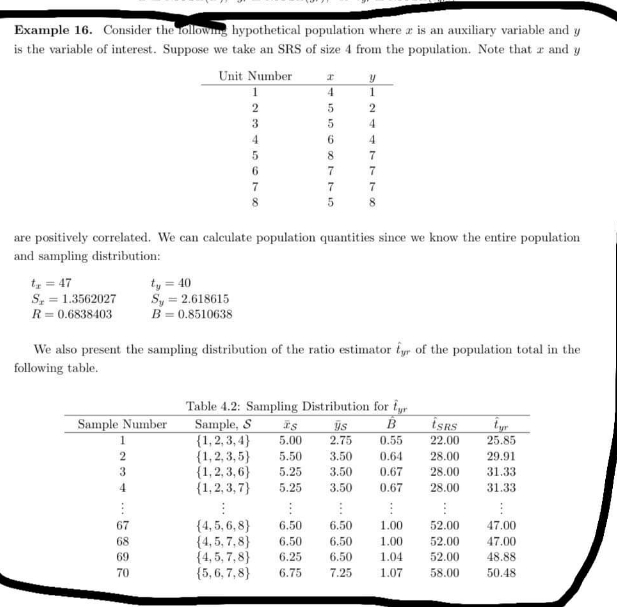
Example 16. Consider the following hypothetical population where a is an auxiliary variable and y is the variable of interest. Suppose we take an SRS of size 4 from the population. Note that r and y Unit Number at - -1 00 0 e are positively correlated. We can calculate population quantities since we know the entire population and sampling distribution: to = 47 ty = 40 S. = 1.3562027 Sy = 2.618615 R = 0.6838403 B = 0.8510638 We also present the sampling distribution of the ratio estimator fyr of the population total in the following table. Table 4.2: Sampling Distribution for fur Sample Number Sample, S Us B iSRS tyr (1, 2, 3,4 } 5.00 2.75 0.55 22.00 25.85 (1, 2, 3,5] 5.50 3.50 0.64 28.00 29.91 (1, 2, 3, 6} 5.25 3.50 0.67 28.00 31.33 4 (1,2,3, 7} 5.25 3.50 0.67 28.00 31.33 67 (4, 5, 6,8) 6.50 6.50 1.00 52.00 47.00 68 (4, 5, 7,8] 6.50 6.50 1.00 52.00 47.00 69 {4, 5, 7,8 ] 6.25 6.50 1.04 52.00 48.88 70 (5, 6, 7,8} 6.75 7.25 1.07 58.00 50.48
Step by Step Solution
There are 3 Steps involved in it

Get step-by-step solutions from verified subject matter experts