

Question: This is the 5th time I'm submitting this question can someone show me the Standard Nor Total Questions Count Count Poor Good (G) Survey's Good
This is the 5th time I'm submitting this question can someone show me the Standard Nor
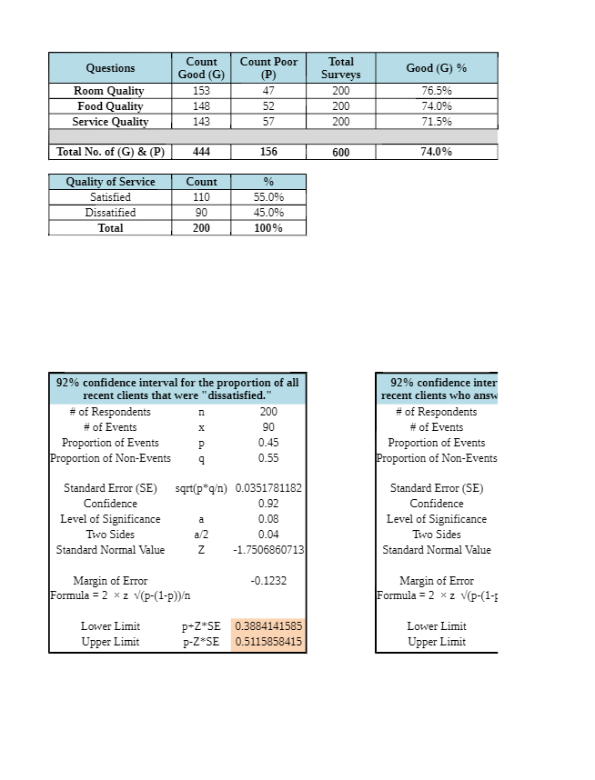
Total Questions Count Count Poor Good (G) Survey's Good (G) % (P) Room Quality 153 47 200 76.5% Food Quality 148 52 200 74.0% Service Quality 143 57 200 71.5% Total No. of (G) & (P) 444 156 600 74.0% Quality of Service Count Satisfied 110 55.0% Dissatified 90 45.0% Total 200 100% 92% confidence interval for the proportion of all 92% confidence inter recent clients that were " dissatisfied." recent clients who answ # of Respondents n 200 # of Respondents # of Events 90 # of Events Proportion of Events 0.45 Proportion of Events Proportion of Non-Events 0.55 Proportion of Non-Events Standard Error (SE) sqrt(p qin) 0.0351781182 Standard Error (SE) Confidence 0.92 Confidence Level of Significance 0.08 Level of Significance Two Sides a/2 0.04 Two Sides N Standard Normal Value -1.7506860713 Standard Normal Value Margin of Error -0.1232 Margin of Error Formula = 2 x z V(p-(1-p)) Formula = 2 x z V(P-(1-I Lower Limit P+Z*SE 0.3884141585 Lower Limit Upper Limit P-Z*SE 0.5115858415 Upper Limit
Step by Step Solution
There are 3 Steps involved in it

Get step-by-step solutions from verified subject matter experts